Calculating time to first IAP
Prerequisites
This guide presents an area of advanced analysis, so ensure you have completed the following:
- Fully instrumented Swrve into your app.
- Have sent in-app purchase data to Swrve using the IAP event.
- Loaded the Swrve raw event data into an AWS Redshift database. For a tutorial on how to do this loading process, see Redshift event import.
Objective
Before looking at how long it takes users to get to their first in-app purchase (IAP), it is interesting to think about why you want this data. This type of data is very useful for optimizing user flow and timing your in-app messages. Many Swrve customers also feed this data back to their product teams to optimize new app versions.
Query steps
It is helpful to break up a complex analysis like this one into smaller, more manageable parts. For example, you could break up the analysis into the following parts:
- When did users make their first IAPs?
- When did users first install your app?
- What is the difference between the install and IAP times?
- Create a histogram of that data.
When did users make their first IAPs?
First, figure out when your paying users made their first IAP. In SQL, this is expressed as follows:
SELECT event_user,
       MIN(event_time) AS first_purchase
FROM events
WHERE event_type = 'iap'
GROUP BY event_user
When did users install your app?
A similar technique also works for figuring out when your users first installed your app, except you don’t need to limit yourself to IAP events:
SELECT event_user,
       MIN(event_time) AS first_session
FROM events
GROUP BY event_user
What is the difference between the install and IAP times?
The next question is what is the difference between these two times. To bring the two queries together, use the following:
WITH

first_purchases AS
  (SELECT event_user,
          MIN(event_time) AS first_purchase
   FROM events
   WHERE event_type = 'iap'
   GROUP BY event_user),

first_sessions AS
  (SELECT event_user,
          MIN(event_time) AS first_session
   FROM events
   GROUP BY event_user),

SELECT first_purchases.event_user,
       datediff(hours,
                first_sessions.first_session,
                first_purchases.first_purchase) AS hours_after_install
FROM first_purchases
JOIN first_sessions ON first_purchases.event_user = first_sessions.event_user
Now you have a list of users and how long it has been between their first event and their first IAP event.
Create a histogram of the data
WITH

first_purchases AS
 (SELECT event_user,
         MIN(event_time) AS first_purchase
  FROM events
  WHERE event_type = 'iap'
  GROUP BY event_user),

first_sessions AS
 (SELECT event_user,
         MIN(event_time) AS first_session
  FROM events
  GROUP BY event_user),

first_purchase_deltas AS
 (SELECT first_purchases.event_user,
         datediff(hours,
                  first_sessions.first_session,
                  first_purchases.first_purchase) AS hours_after_install
  FROM first_purchases
  JOIN first_sessions
    ON first_purchases.event_user = first_sessions.event_user)

SELECT hours_after_install,
       COUNT(1)
FROM first_purchase_deltas
GROUP BY hours_after_install
ORDER BY hours_after_install DESC
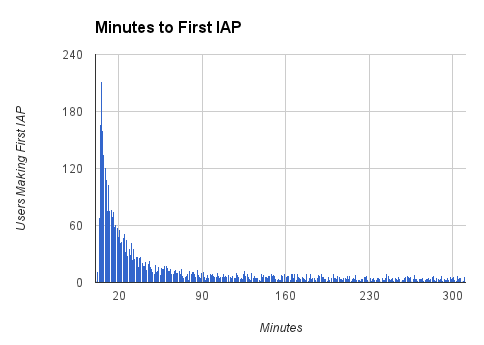
Example result
Actions to take
In this example, the results show the first twenty minutes are absolutely crucial, so you could consider setting up an in-app message campaign targeted at non-payers after 10, 20 and 30 minutes of app usage. Every app is different, so study this for your own user base.
Most Swrve customers can self-host this pipeline; all you have to do is follow the steps in these tutorials. However, if you prefer a turn-key hosted solution, we do offer one as a professional service. There is an additional fee associated with this service. For more information, contact your CSM at support@swrve.com.
Swrve support can help you with basic setup and configuration of the pipeline described above. If you need help with your queries, contact our Data Services team at support@swrve.com. They will help you get the most out of your data with dedicated support, pre-built and custom reports, and dedicated data science hours.
