Top Items report
The Top Items report enables you to track your top-selling items in terms of both real currency (USD) and any virtual currencies you have set up. You can track your top-selling items by unit sales, by currency spent and by items most commonly purchased after users have bought virtual currency. By monitoring your top-selling items, you can:
- Identify trends in top-selling items over time to highlight, for example, peaks during certain periods (such as Christmas or sporting seasons).
- Compare how top-selling items vary between different user segments.
- Compare real currency and virtual currency top-sellers.
- Use the top-selling item data to plan targeted in-app messages or push notifications. For example, you might notice that a particular item is popular with users in a high-spenders segment. In this instance, you could target promotional in-app messages at those users to encourage them to purchase similar or related items. For more information about in-app messaging in Swrve, see Intro to in-app messages. For more information about push notifications, see Intro to push notifications.
- Identify top-selling items that would make good candidates for resource A/B testing. For example, if an item is not generating as many unit sales as you would have expected over time, you could investigate whether you should reconsider the pricing of the item by performing a resource A/B test. For more information about resource A/B testing in Swrve, see Intro to resource A/B testing.
Swrve tracks top-selling items (in real currency) by means of IAP events and top selling items (in virtual currency) by means of purchase events. For technical information about sending events to Swrve, see the platform-specific Integration guide.
To access the Top Items report, on the Analytics menu, select Top Items. The following image shows an example of a typical Top Items report:
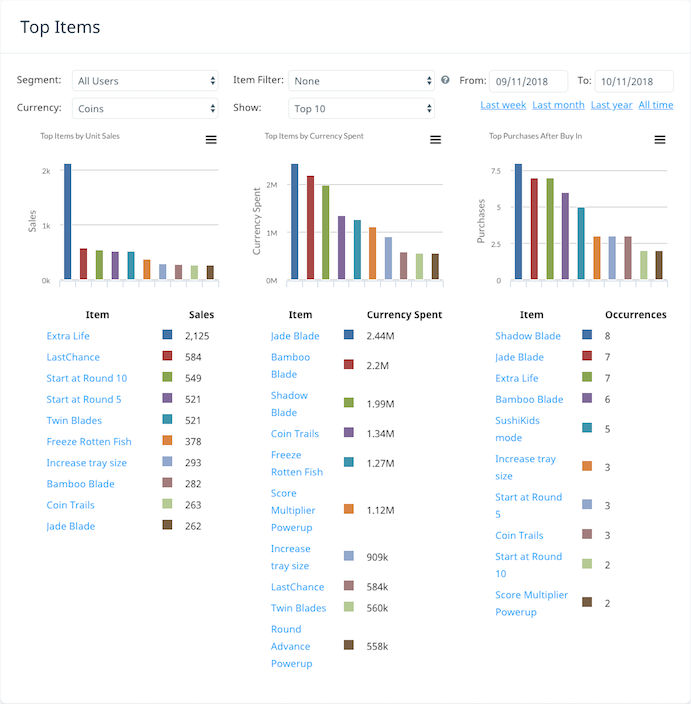
The report displays a bar chart and table for each of the following:
- Top Items by Unit Sales.
- Top Items by Currency Spent.
- Top Purchases After Buy In – in brief, this chart answers the question ‘What items did a user want so badly that they spent real money to be able to buy them?’. If a user spends virtual currency buying a certain item, it could have happened in one two of ways:
- The user had some virtual currency (such as coins or gems) available, saw the item and purchased it.
- The user started with no virtual currency but wanted to buy the item. They visited the store, bought virtual currency and then immediately purchased the item. This is what is captured in the Top Purchases After Buy In chart.
A purchase event represents a user swapping real money for virtual currency. For example, a user spending $0.99 on 100 in-app gems. An IAP event represents a user spending real money for some reward (which might include virtual currency). For example, the user spends $1.99 on a bucket of gems which gives the user 1,000 gems and a free sword. In either of these cases, Swrve treats the user as having just purchased gems. When the user then proceeds to buy an item using gems as the currency, Swrve includes that item once in the Top Purchases After Buy In chart. Swrve then resets the user to no longer having just purchased gems. Swrve has a separate store per-user per-currency, so a user can be marked as having just bought more than one currency. A user that is marked as having purchased gems and coins would have to make one purchase in gems to update the Top Purchases After Buy In chart for gems, and then another purchase with coins to update the chart for coins.
The Top Purchases After Buy In chart and table are empty if you select USD from the Currency list.
You can perform the following actions to customize the data displayed on the Top Items report:
- Define the time range for which the data is generated.
- Filter the data by segment, currency and item filter.
- Limit the data to include the top-10, top-100 or all top-selling items.
In addition, you can perform the following actions on the Top Items report:
- Print each of the Top Item bar charts.
- Save the data for each of the Top Item bar charts in CSV file format.
Customizing top items data
The following sections provide information about how to customize the data included in your Top Items report.
Defining the time range
There are two options for defining the time range:
- In the From and To calendar fields, manually enter the dates for the time range.
- Select a set time range (Last week, Last month, Last year or All time).
Filtering the data
To filter the data included in the Top Items report, select one or more of the following filters:
- Segment – filter by user segment.
- Currency – filter by real currency (USD) or by any of the virtual currencies that have been defined for your app. You usually define the virtual currencies that are required for your app when adding platform titles as part of the Swrve onboarding process. You can also edit platform titles (including the app currencies) later on, if required, on the App Settings screen. For more information, see How do I edit existing platform titles?
- Item Filter – apply a particular item filter. Item filters are sub-sets of grouped items. You define item filters on the Resources screen. To access this screen, on the Optimization menu, select Resources. For more information about defining item filters, see Intro to Swrve analytics.
Limiting the number of top-selling items
To limit the number of top-selling items to include the top-selling 10 items, 100 items, or all items, select the required value from the Show list.
Additional actions
The following sections provide information about the additional actions you can perform on the Top Items screen.
Printing the top item graphs
To print one of the three Top Item report bar charts, on the menu in the top right-hand corner of the chart, select Print. Depending on the type of browser you are using, the print screen or print dialog box displays. Define your required print settings and print the Top Items graph.
Saving top item data in CSV format
To save the data from one of the three Top Item report bar charts in comma-separated value (CSV) file format, on the menu in the top right-hand corner of the chart, select Download CSV.