Monetization queries
This article explores a typical app’s monetization and how it can reveal user behavior.
How many session starts occur per IAP?
Now that we’ve learned about how users get to their first purchase, let’s look at behavior surrounding subsequent IAPs. Here we look at how many session starts and IAP events your users have fired, and compare the ratio of session_starts to IAPs. This is broken out by users who make one, two, three or more IAPs, which can be a great way to see how your repeat buyers are behaving.
SELECT swrve_iap,
       AVG(swrve_session_start),
       COUNT(1)
FROM events_fired
GROUP BY swrve_iap
Example result

Actions to take
The results in this example show a regular pattern, with consistent intervals between sessions for in-app purchases. You’ll want to use this to prime users as they approach these thresholds with in-app messages targeted to users on their 8th, 14th and 20th sessions.
How many IAPs do users make?
We’ve learned how long it takes users to become payers and how many sessions are started by people making one, two, three or more IAPs. This query simply shows how many users have made one or more IAPs.
SELECT swrve_iap,
       COUNT(1)
FROM events_fired
GROUP BY swrve_iap
Example result
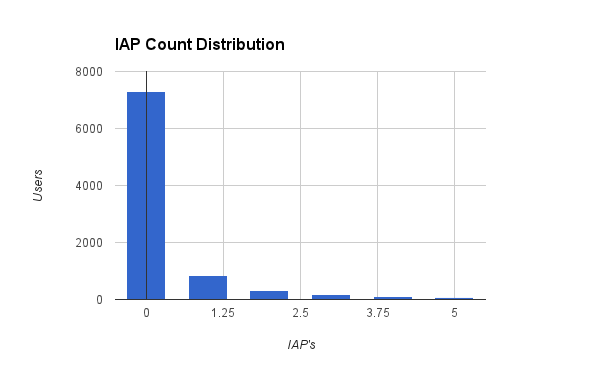
Actions to take
Most payers only make one IAP. We can use the knowledge we’ve gained so far to target them with an in-app message at the appropriate time, and see how user behavior changes.
How does LTV vary by lifetime?
We know how many people buy, when they buy and how often they buy. How much do they spend over their whole active lifetime? Are long term users more valuable than short term users? The query below reveals a histogram of values for total real-world spend in US cents, broken out by player lifetime. Increasing retention and re-engagement are important, but this will show if a user who is active for 50 days actually spends more than one who is active for five days.
SELECT datediff(day,date_joined,last_active) as lifetime,
       AVG(spend) as average_spend,
       COUNT(1) as occurrences
FROM swrve_properties
GROUP BY datediff(day,date_joined,last_active)
Example result
| Lifetime | Average Spend | Occurrences |
|---|---|---|
| 0 | 17 | 544010 |
| 1 | 57 | 31500 |
| 2 | 88 | 23567 |
| … |
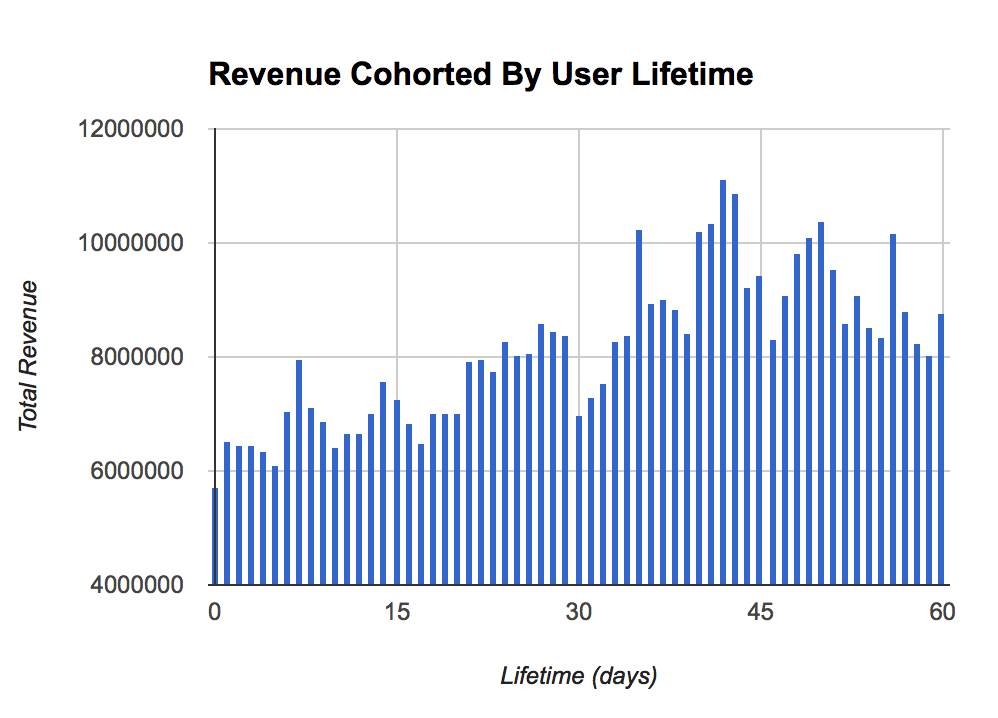
How much revenue comes from users with different lifetimes?
The above query is a great way to see how much total spend varies between a long term and a short term user. However, it doesn’t show how much of your total revenue comes from users with long lifetimes versus those with short lifetimes. This query reveals how much of your revenue has come from each user cohort, broken out by days.
SELECT datediff(day,date_joined,last_active),
       AVG(spend),
       COUNT(1),
       AVG(spend) * COUNT(1) as revenue
FROM swrve_properties
WHERE spend > 0
GROUP BY datediff(day,date_joined,last_active)
Example result
Most Swrve customers can self-host this pipeline; all you have to do is follow the steps in these tutorials. However, if you prefer a turn-key hosted solution, we do offer one as a professional service. There is an additional fee associated with this service. For more information, contact your CSM at support@messagegears.com.
Swrve support can help you with basic setup and configuration of the pipeline described above. If you need help with your queries, contact our Data Services team at support@messagegears.com. They will help you get the most out of your data with dedicated support, pre-built and custom reports, and dedicated data science hours.