User acquisition analysis
The Swrve dashboard provides powerful, actionable insights into your users’ behavior. In particular, the User Acquisition report enables many Swrve customers to make data-driven decisions about their marketing strategies. However, as customers learn more about their users they often want to perform deeper analysis than what’s available in the dashboard. The Swrve User DB data enables you to do this. This article describes how to use the User DB data for user acquisition analyses.
Prerequisites
This guide presents an area of advanced analysis, so ensure you have completed the following:
- Fully instrumented Swrve into your app.
- Have access to the User Acquisition report in the Swrve dashboard and are seeing accurate data appear in the report. The User Acquisition report is enabled on a per-dashboard basis. To enable this feature, contact support@messagegears.com.
- Downloaded the Swrve User DB and loaded it into a database to allow querying. For a tutorial on how to automate this loading process, see Automating user DB imports.
User Acquisition report
To start, let’s look at a sample User Acquisition report:
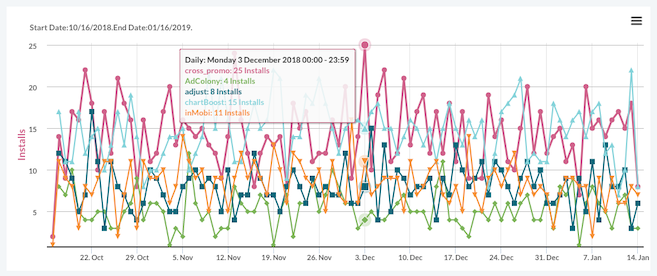
The User Acquisition report displays important details from your attribution networks. If you have not used theUser Acquisition report yet, we strongly recommend you analyze it and understand the metrics it provides before proceeding with this guide. At a minimum, you should understand and have tried to optimize the Return per install metric. This is a great first measurement to use to ensure your referral sources are generating more revenue than they cost.
This guide shows you how to use the Swrve user DB to analyze the Return per install metric at a more granular level. The goal of the analysis is to further optimize the Return per install metric with existing referral partners. The examples referenced use data from a hypothetical app developer to illustrate how to perform this analysis.
Viewing return per install
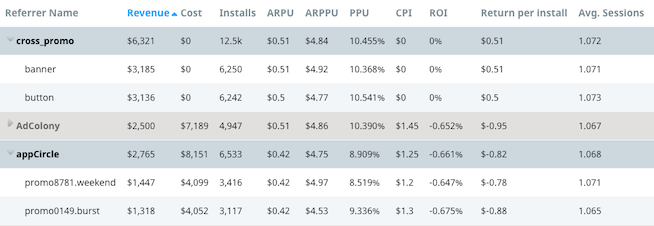
In the example User Acquisition report below, under the cross_promo channel, you can see the button campaign is generating $0.50 on average for each install. Under the appCircle channel, the promo8781.weekend campaign is losing $0.78 on average for each install. The app developer has tried to optimize these numbers and has worked with referral partners to do this.
The developer has an iOS app. The marketing analyst on the team believes different iOS devices may monetize at different rates. If true, this would enable targeting users more accurately through referral channels and increasing Return per install. With the User DB loaded into an SQL database, this analysis is quick and easy to perform.
Recalculating return per install with the user DB
A good first step to take with Swrve user DB data is to attempt to replicate the data in the Swrve User Acquisition report with an SQL query. Since the Swrve dashboard updates multiple times a day and the user DB exports update only once every 24 hours, there are discrepancies between the two reports. It’s good to understand this as a baseline so you know if further analyses need to take the discrepancy into account.
Depending on the database platform you use, the query to replicate the information of most interest is:
Redshift
SELECT SPLIT_PART(swrve_referrer_id, '.', 1) AS campaign,
       SPLIT_PART(swrve_referrer_id, '.', 2) AS creative,
       COUNT(1) AS user_count,
       SUM(spend) / 100.0 AS total_spend,
       SUM(swrve_referrer_cost) / 100.0 AS total_cost,
       ((SUM(spend) / 100.0) - (SUM(swrve_referrer_cost) / 100.0)) / COUNT(1) AS return_per_user
FROM swrve_properties
WHERE date_joined > CURRENT_DATE - INTERVAL '90 days'
GROUP BY SPLIT_PART(swrve_referrer_id, '.', 1),
         SPLIT_PART(swrve_referrer_id, '.', 2);
The results include the Return Per Install metric from the User Acquisition report. Check this result with what you see in your Swrve dashboard. The numbers in the Swrve dashboard should be close to the numbers in the query result.
Advanced device segmentation with the user DB
The next step is to add device information to the report. This is the easiest part of this guide—you only need to add two lines to the previous SQL query. The required query is:
Redshift
SELECT SPLIT_PART(swrve_referrer_id, '.', 1) AS campaign,
       SPLIT_PART(swrve_referrer_id, '.', 2) AS creative,
       swrve_device_name,
       COUNT(1) AS user_count,
       SUM(spend) / 100.0 AS total_spend,
       SUM(swrve_referrer_cost) / 100.0 AS total_cost,
       ((SUM(spend) / 100.0) - (SUM(swrve_referrer_cost) / 100.0)) / COUNT(1) AS return_per_install
FROM swrve_properties
WHERE date_joined > CURRENT_DATE - INTERVAL '90 days'
GROUP BY SPLIT_PART(swrve_referrer_id, '.', 1),
         SPLIT_PART(swrve_referrer_id, '.', 2),
         swrve_device_name;
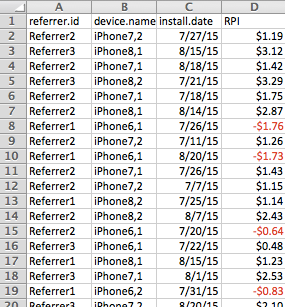
In tabular form, the data should look similar to this:
While this enables you to aggregate the data along the dimensions you’re interested in, it doesn’t provide the insights you’re looking for. To build a more insightful report, use a pivot table in Microsoft Excel (or similar software; for example, Tableau, R). This displays the average Return Per Install for every combination of referrers and device types:
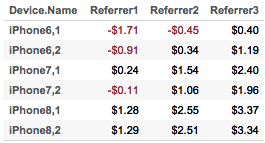
The results indicate the iPhone 6,1 gives a negative Return Per Install for two referrers. iPhone 6,2 and iPhone 7,1 are negative for one referrer. This is the exact information you want to know and enables you to target devices with your referral partners more effectively. For example:
- Referrer 1 should only send iPhone 7,1; iPhone 8,1 and iPhone 8,2 traffic.
- Referrer 2 should only send iPhone 6,2; iPhone 7,1; iPhone 7,2; iPhone 8,1 and iPhone 8,2 traffic.
- Referrer 3 may send all traffic.
With this information, you can now expect to see a positive Return Per Install for all referrer partners.
Most Swrve customers can self-host this pipeline; all you have to do is follow the steps in these tutorials. However, if you prefer a turn-key hosted solution, we do offer one as a professional service. There is an additional fee associated with this service. For more information, contact your CSM at support@messagegears.com.
Swrve support can help you with basic setup and configuration of the pipeline described above. If you need help with your queries, contact our Data Services team at support@messagegears.com. They will help you get the most out of your data with dedicated support, pre-built and custom reports, and dedicated data science hours.