User acquisition report
The User Acquisition report enables you to analyze the performance of your different paid referrer channels and campaigns.
Swrve tracks user acquisition channel and cost by means of two user properties: swrve.referrer_id and swrve.referrer_cost. For technical information about setting up your app to track user acquisition, see the User acquisition tracking guide. Alternatively, you can upload referrer and cost information directly in the Upload Acquisition Costs section of the report.
Swrve then enables you to target push notifications or in-app messages at users from specific referrer channels or campaigns. For example, you could tailor offers for users originating from Tapjoy by targeting users with the Properties filter type referral, contains, tapjoy, and then messaging them accordingly. For more information about targeting push notifications and messages, see Intro to push notifications and Intro to in-app messages.
To access the User Acquisition report, on the Analytics menu, select User acquisition. The following image shows an example of a typical User Acquisition report:
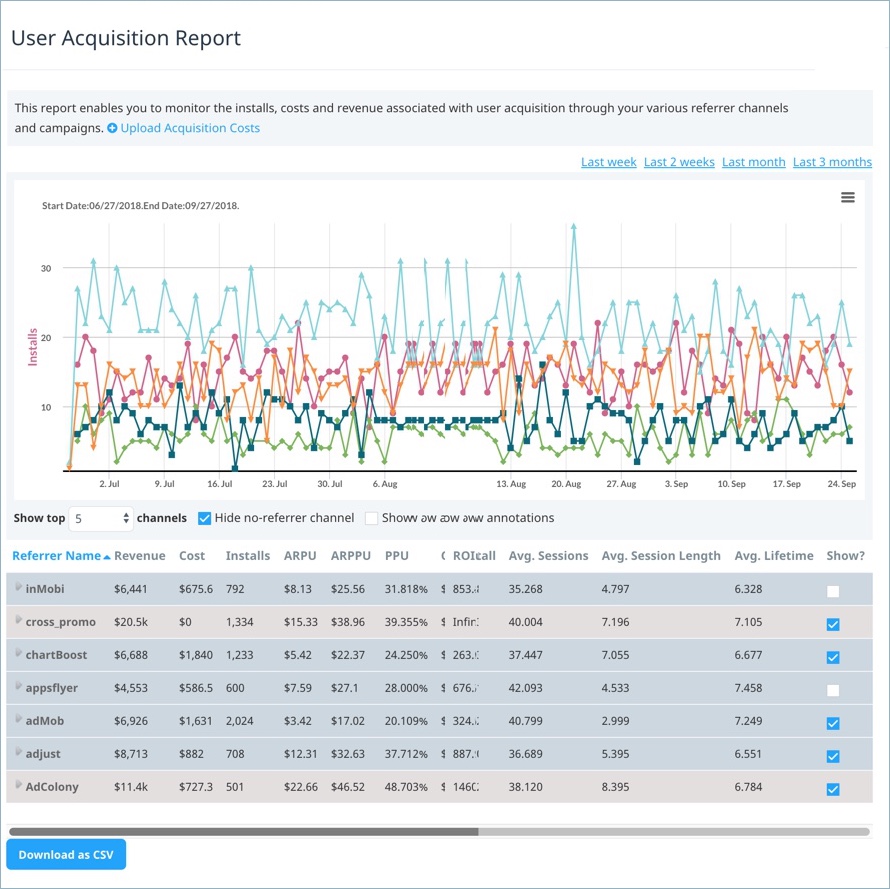
The graph at the top of the screen displays the number of installs for each referrer channel over time.
Report metrics
Below the graph, a table displays user acquisition metrics, providing the performance data for each acquisition channel. For column descriptions, see the following table.
| Column | Description |
|---|---|
| Referrer Name | The referrer channel and campaign as provided by the swrve.referrer_id user property. The recommended format is [CHANNEL_NAME].[CAMPAIGN_NAME] (for example, tapjoy.promo12345). We report results for each individual campaign and aggregate the data for each channel. |
| Revenue | The total USD-equivalent revenue generated. |
| Cost | The total cost of this acquisition channel, as provided by the swrve.referrer_cost user property. |
| Installs | The total number of installs obtained through this acquisition channel. |
| ARPU | The average revenue per user. |
| ARPPU | The average revenue per paying user. |
| PPU | The percentage of users from whom you have earned revenue. |
| CPI | The average cost per install. |
| ROI | The percentage return on investment. This figure is calculated as the difference between the total revenue and total cost, as a percentage of the total cost. |
| Return per install | This difference between the ARPU and CPI. |
| Avg. Sessions | The average number of sessions per user. |
| Avg. Session Length | The average session length, in minutes, of users from this referrer. |
| Avg. Lifetime | The average number of days between the install date and the last active date. This is the average elapsed time between when a user installs your app and the last time they used the app. |
Select the Show checkbox to show/hide a referrer from the graph display above.
You can perform the following actions to customize the data displayed in the User Acquisition graph:
- Select the time range for which the data is generated.
- Limit the data displayed in the graph to include only the top performing 1, 3, 5, 10 or 20 acquisition channels.
- Exclude the installs for which you have no referrer data.
- Hide or show annotations.
In addition, you can perform the following actions on the User Acquisition Report screen:
- Sort the data displayed in the table below the graph by any of the columns.
- Print the user acquisition report graph.
- Download user acquisition report graph data in CSV file format.
- Manage uploading of acquisition costs.
Customizing user acquisition data
The following sections describe how to customize the data included in your user acquisition report.
Defining the time range
To define the time range, select an option above the top right corner of the graph:
- Last week – displays data for the last 7 days.
- Last 2 weeks – displays data for the last 14 days.
- Last month – displays data for the last calendar month.
- Last 3 months – displays data for the last 90 days (the maximum time range available).
Excluding installs for which you have no data
To exclude installs for which you have no acquisition channel data from showing on the report, select the Hide no-referrer channel check box.
Limiting the number of channels
To limit the graph data to include only the top-performing 1, 3, 5, 10 or 20 acquisition channels, select the required N value from the Show top N channels list.
Additional actions
The following sections describe additional actions you can perform on the User Acquisition Report screen.
Sorting table data
Sorting the data in the table below the graph enables you to identify trends. For example, sorting the User Acquisition report by ARPU (average revenue per user) enables you to identify the campaigns that are giving you the highest value users. Sorting by Mean Lifetime or Mean Session enables you to identify the campaigns that are giving you the most engaged users.
Printing the user acquisition graph
To print the user acquisition graph, on the menu in the top right corner of the graph, select Print. Depending on the type of browser you are using, the print screen or print dialog box displays. Define your required print settings and print the graph.
Saving user acquisition data in CSV format
You can save the following user acquisition data in comma-separated values (CSV) file format:
- Graph data – to save user acquisition graph data in CSV format, on the menu in the top right corner of the graph, select Download CSV.
- Table data – to save user acquisition table data in CSV format, select Download as CSV below the table.
Upload acquisition costs
The Uploads Acquisition Costs section above the graph enables you to upload a CSV file containing the acquisition costs for each user per channel and campaign. The data you upload takes 24 hours to influence the results displayed in the graph.
To upload the acquisition costs CSV file:
- On the User Acquisition Report screen, select Upload Acquisition Costs to expand the section.
- Create a CSV file of up to 1,000 lines formatted as user id, acquisition cost. The first column of the CSV file must contain the Swrve user IDs, while the second must contain the acquisition cost (in dollar cents) for these users. For example, a CSV file with the line 12345, 7.5 indicates that the acquisition cost for the user with ID 12345 was $0.075.
- Upload the CSV file in the Upload Acquisition Costs section, ensuring that the ID selected in the Referrer channel and Referrer campaign list is the same as that used in your CSV.
- Select Submit.