Intro to Swrve analytics
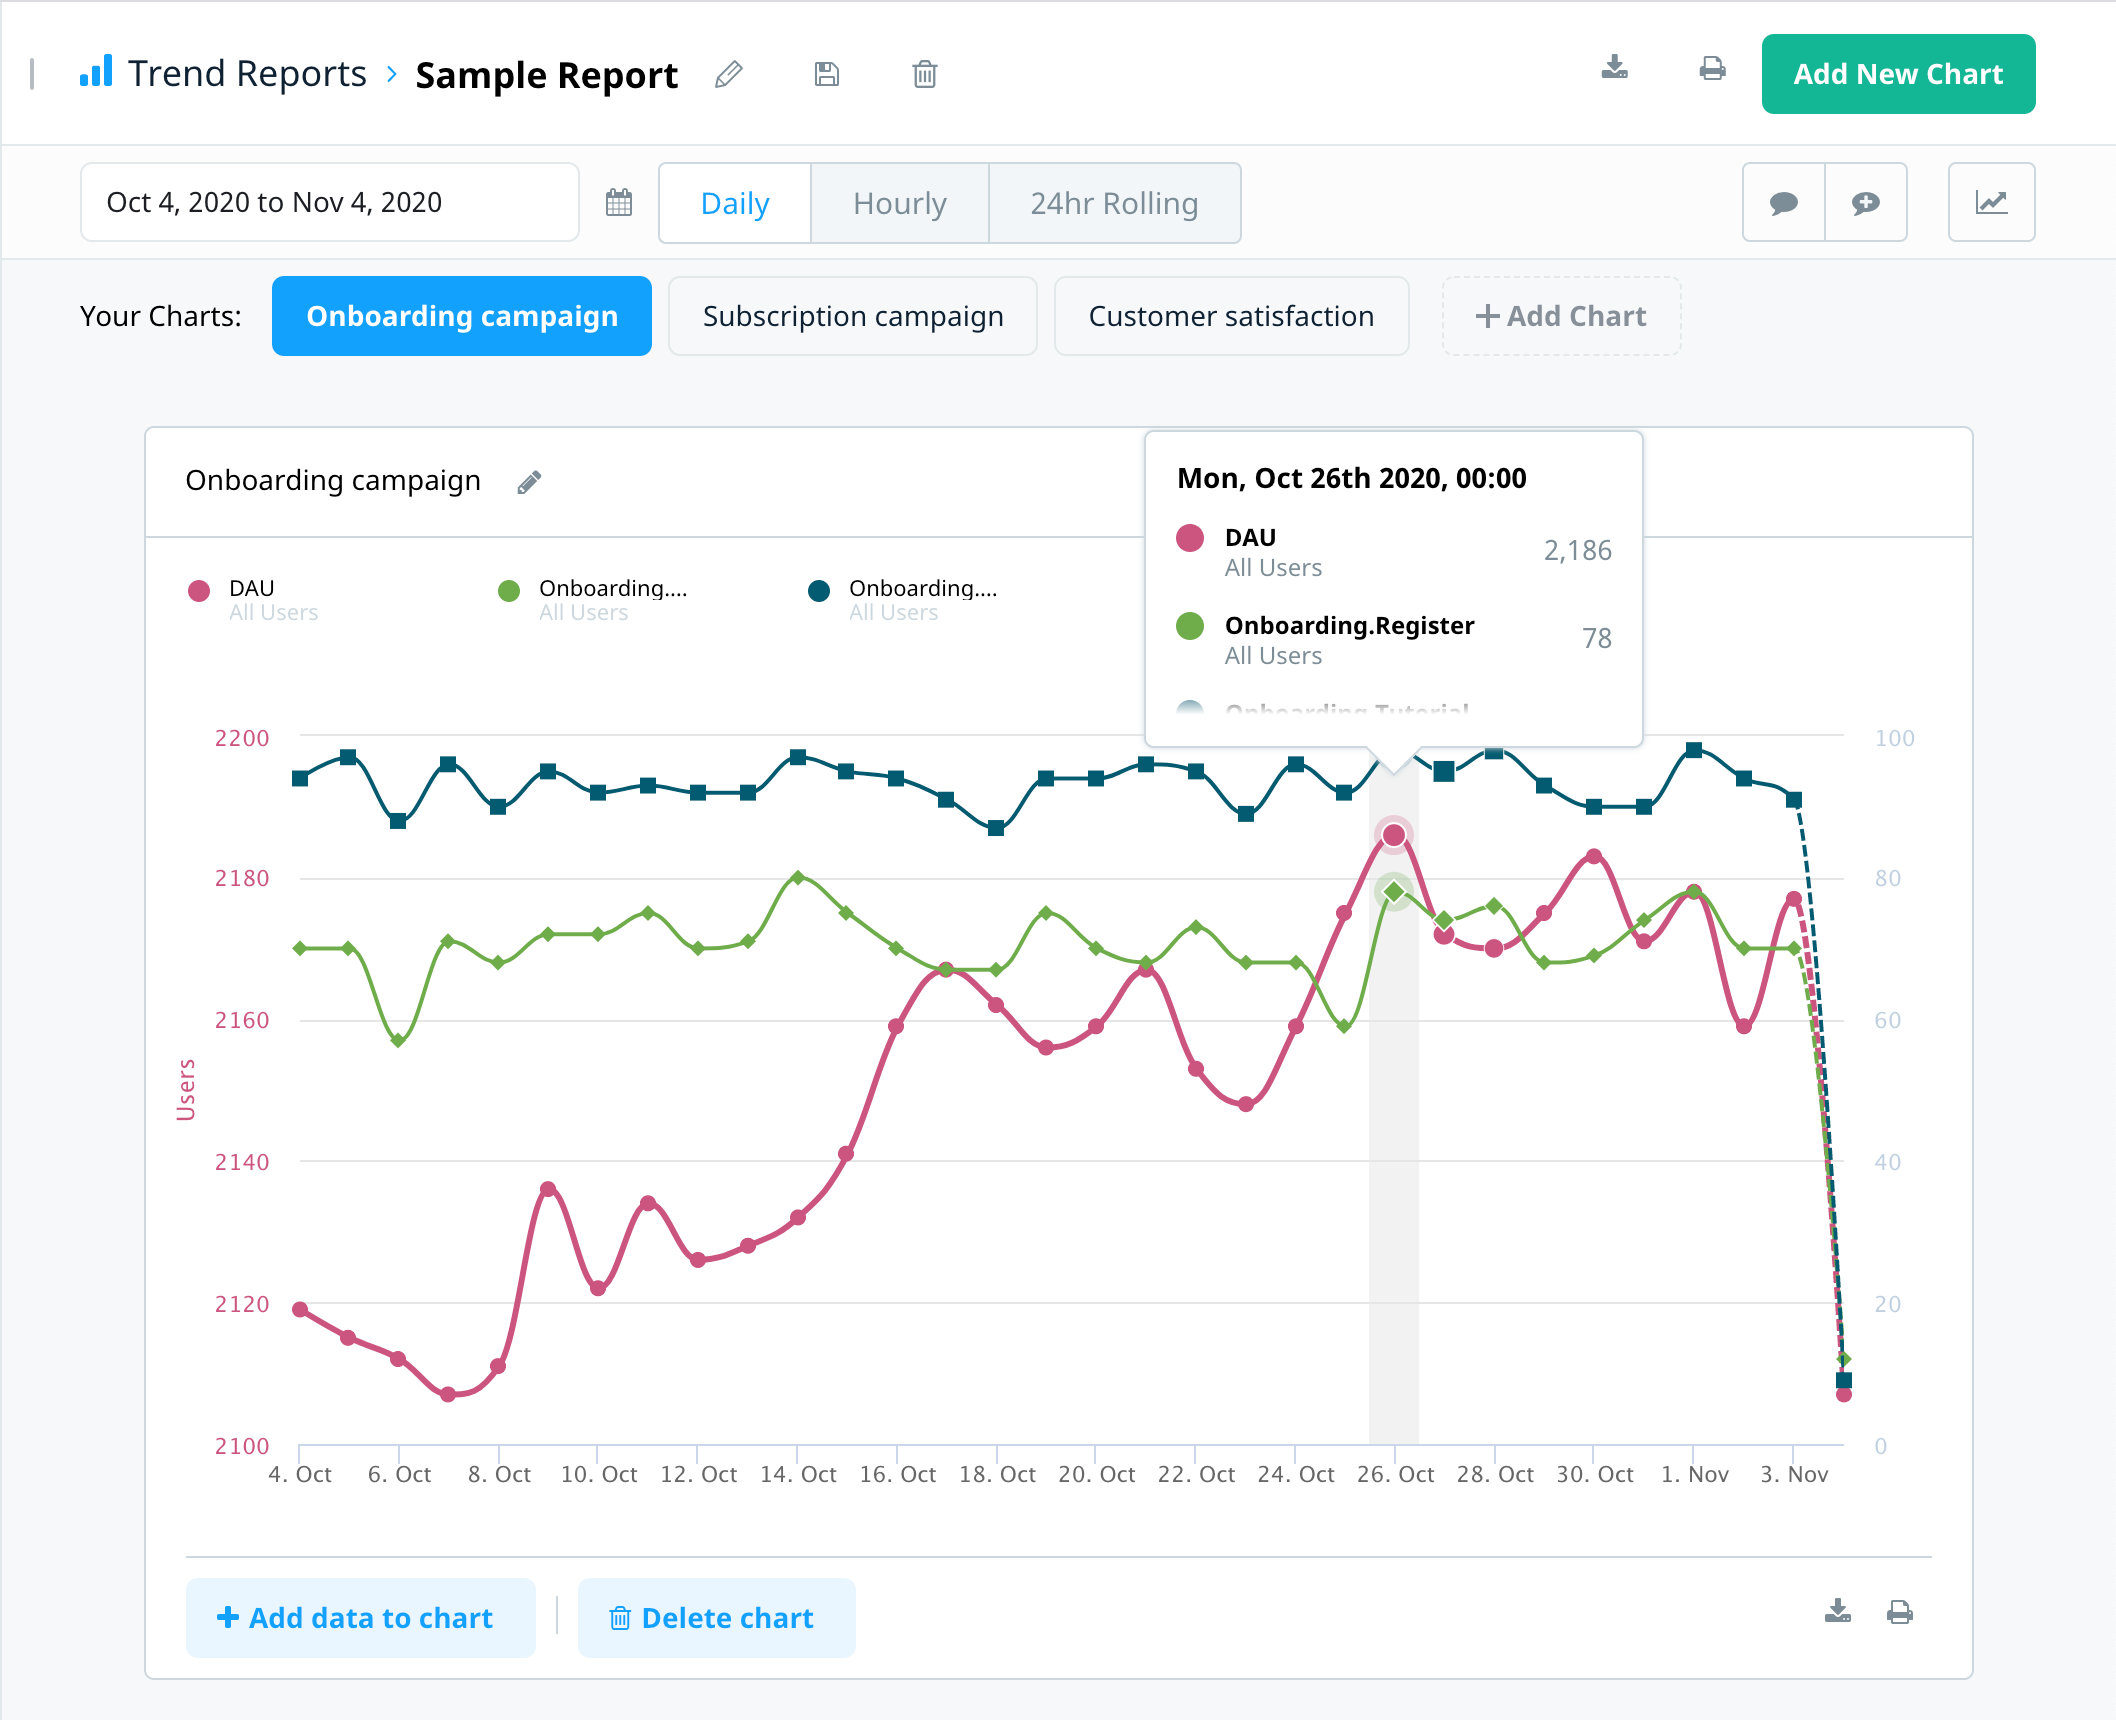
The Analytics menu provides access to Swrve’s analytic tools. Within this menu, you can access a variety of reports, such as the Trend report example below:
Monitor and compare analytic data with the following reports available in Swrve:
- Push opt-in reports – Monitor annual and monthly push notification opt-in rates to gain valuable insights into your push channel’s effectiveness, providing opportunities to enhance user engagement and retention. For more information, see Push opt-in reports.
- Trend reports – Swrve’s Trend Reports let you build reports comparing KPIs, event counts or item purchases for all your users or any subset of users, including campaign audiences. For more information, see Trend reports.
- Events – reports on all events sent to Swrve from your app. For more information, see Events report.
- User acquisition – track how different paid referrer channels perform for your app. This report calculates several metrics per channel and campaign, such as ARPU, cost per install (CPI), and return on investment (ROI). For more information, see User acquisition report.
- User cohorts – view how retention, revenue, sessions per user, and average session time are changing over time. For more information, see User cohorts report.
- User attributes – view a snapshot of your users in both graphical and tabular format. For example, you can view the lifetime spend, level, app version, and location of all your users or a particular user segment. For more information, see User attributes report.
- User DB downloads – download different data sets of your user profiles and import user DB CSV files into a local database or reporting tool to run ad-hoc data-mining queries. For more information, see Intro to user databases.
- Top items – reports on your top-selling items in terms of unit sales and currency spent. For more information, see Top items report.
- Funnels – displays funnel progress data for your app, enabling you to identify exactly where users are experiencing issues. You can use this data to jump right in and A/B test changes to the user experience that will make a difference. For more information, see Funnels report.
- Holdout Experiments – enable you to automatically exclude a percentage of new users from new campaigns to compare the projected uplift in key metrics between users not exposed to marketing campaigns (holdout group) versus those who are (treatment group). For more information about, see Campaign holdout experiments.
- Item Charts – reports on item sales, both in real and virtual currency, and in terms of unit sales and total revenue. For more information, see Item charts report.
You can also view a summary of your app’s performance on the KPI metrics dashboard. For more information about the analytic data available in the KPI Metrics dashboard, see The KPI metrics dashboard.
Events and analytics
To understand analytics in Swrve, it’s useful to have a basic understanding of the concept of events. Swrve tracks user behavior by means of events. Each time a user performs an action in your app that you’re interested in (such as opening the app, starting a tutorial or making an in-app purchase), your app sends Swrve an event to track it (this is configured by your development team when they set up Swrve to work with your app). Events are the basis for all KPIs and analytic data that you view through the Swrve service.
Report annotations
An annotation is a vertical line with associated text that display on various Swrve calendar graphs to indicate a point in time where a key event occurred. To display annotations on a graph, select Toggle annotations or the Show annotations check box.
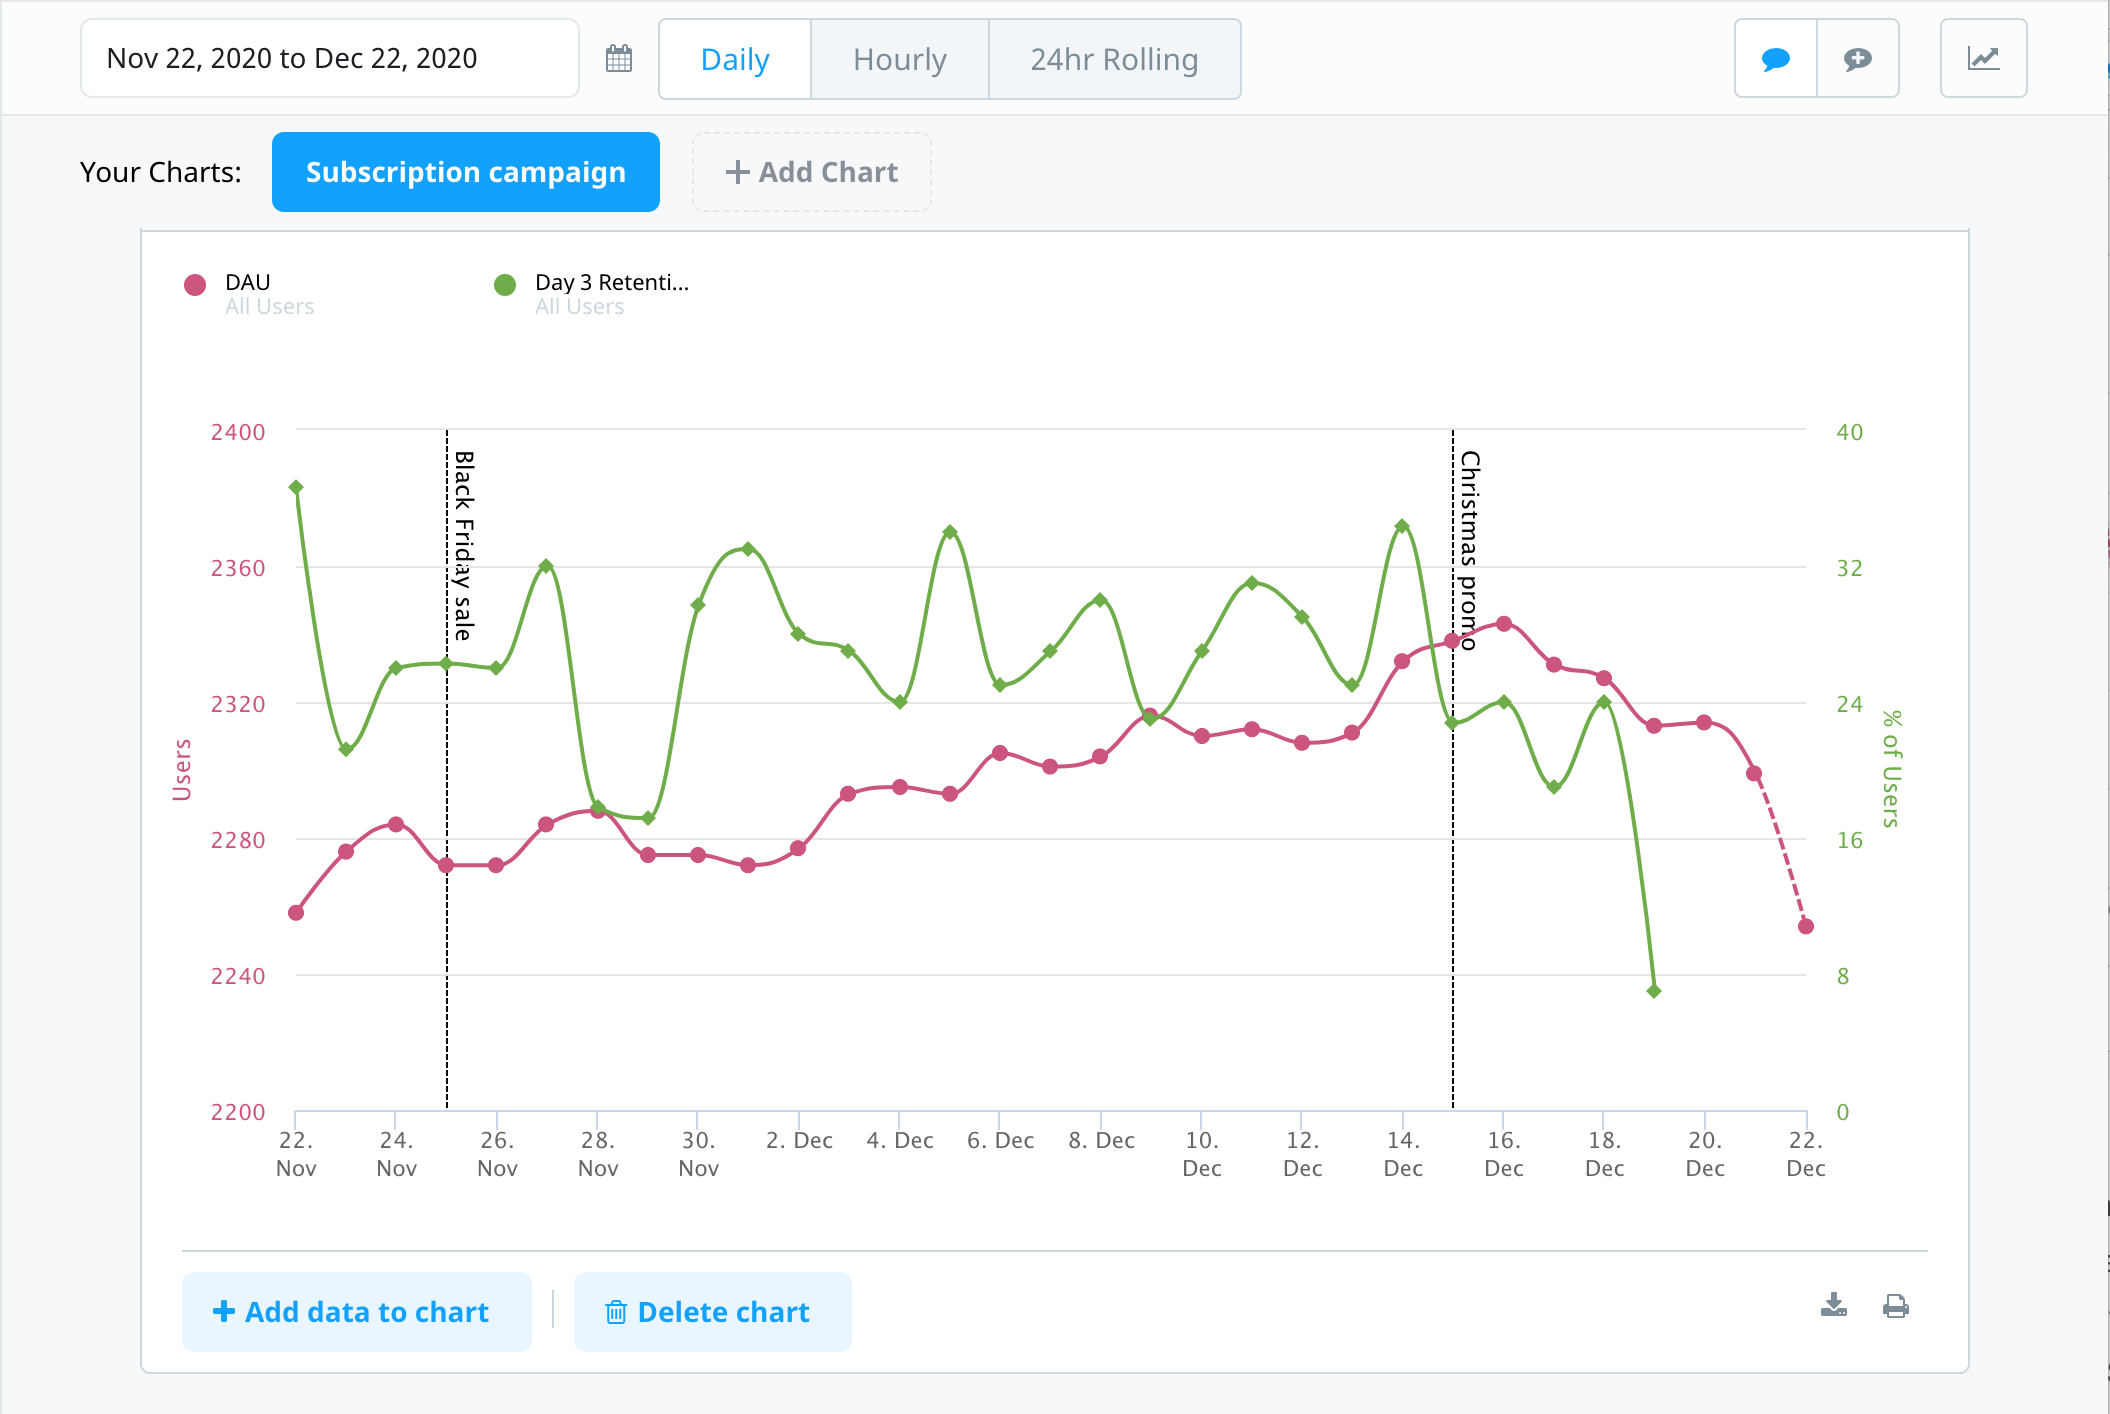
The annotations that display if you select Toggle / Show annotations depend on the annotations that are available on the Report Settings screen. The Report Settings screen displays any annotations you manually create and any annotations that Swrve automatically creates to mark the start of your A/B tests. Swrve may also add annotations from time to time to indicate changes in the Swrve service. Annotations may overlap in time, though individual annotations only ever span a single day.
Creating annotations
To manually create an annotation:
- On the Settings menu, select Report settings.
- In the Annotations section, select Add Annotation.
- In the Date and Name fields, enter the date and name of the event.
- Select Add Annotation.
The annotation displays the next time you select Toggle / Show annotations on a graph for which annotations are available, provided that the date range of the graph includes the date of the annotation event.
Item filters
Item filters are groups of items that you can use to filter data in the Top Items report and the Item Charts report.
Creating item filters
To create an item filter:
- On the Optimization menu, select Resources.
- On the Resources screen, select Create / edit filter.
- To apply any required item and revenue filters:
- In the Resource Filters or Revenue Filters category, select the required filter (for example, Name, Sales). The Filter where controls appear.
- Use the Filter where controls to define your filter value.
- Select Add to filter.
- To apply a Resource Attribute filter, select the required attribute from the Select a resource attribute list and select Add filter for this attribute.
- To save the item filter, elect Save this filter .
- In the Save Filter dialog, enter the Segment name and then select Save.
Next steps
- Find out more about any of the reports detailed in this article by selecting the links provided above in each report description.
- Find out more about KPIs in Swrve. For more information, see Intro to KPIs.