Funnels report
The Funnels report displays select app funnels in graphical and tabular format. A funnel represents the linear flow through a sequence of selected app events (sent from the app to Swrve) to enable you to identify drop-offs.
To access the Funnels report, on the Analytics menu, select Funnels.
You can perform the following actions to customize the data displayed in the report:
- Specify the time period for which funnel data is displayed.
- Select the funnel for which you want to view data.
- Select the user segment for which you want to view data.
In addition, you can perform the following actions on the Funnels screen:
- Rename the currently selected funnel.
- Delete the currently selected funnel.
- Create a new funnel.
- Save report data in CSV file format.
For information about how events are processed for funnels, see How are events processed for funnels?
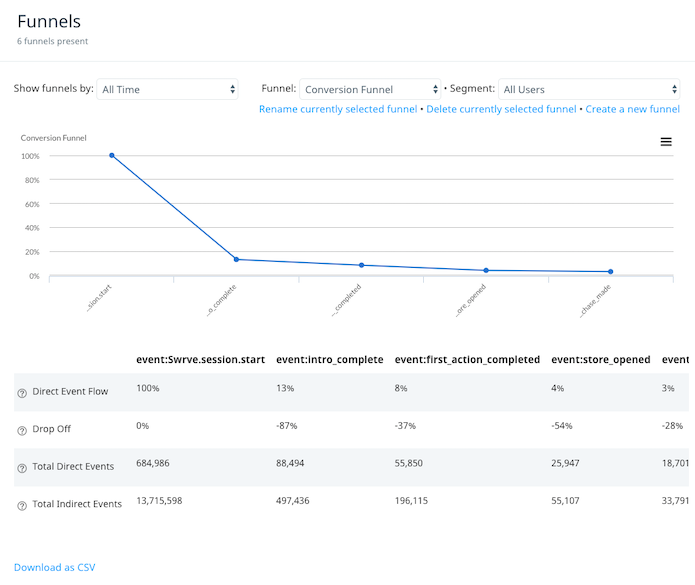
The following image shows an example of a typical funnel report:
The funnel report has three possible views:
- All time
- Week
- Day
All Time view
If you select All Time from the Show funnels by list, the report displays the following data for each funnel event:
- Direct Event Flow – the proportion of users, relative to the total number of users who entered the funnel, who have triggered the funnel events in sequence.
- Drop Off – the percentage drop in users who trigger the event relative to the numbers who triggered the previous event in the funnel sequence.
- Total Direct Events – the total number of times that each event in the funnel has been triggered in the sequence defined by the funnel (that is, a user is only counted in this number the first time they go through the funnel). For example, if user goes through a tutorial once, that user is included in the Total Direct Events count.
- Total Indirect Events – the total number of times that each event has been triggered, regardless of the order in which they were triggered (that is, a user can be counted multiple times in this number). For example, if user goes through a tutorial a second time, their second session is included in the Total Indirect Events count.
Week view
If you select Week from the Show funnels by list, the report displays funnel progress data for users who started funnel progress in a particular calendar week. Users must complete the funnel within the same week to be fully counted towards that week’s funnel counts. If they fail to complete the funnel within that calendar week, they are considered as having dropped off.
Day view
If you select Day from the Show funnels by list, the graph at the top of the report displays funnel progress data for users who started funnel progress in the last five days. The table below the graph displays funnel progress data for users who started funnel progress on the date listed in the Funnel Date column. As with the week view, users must complete the funnel within the same calendar day in order to be fully counted towards that day’s funnel counts.
For example, if a user starts a funnel at 23:59 on day 1, they are counted as contributing to that funnel on day 1. If they complete the funnel at 00:01 on day 2, they neither fully contribute to the day 1 funnel (which registers as incomplete) nor do they contribute to the day 2 funnel (because they didn’t start the funnel during day 2). The day view is useful for funnels where you expect the user to complete the funnel within a short space of time.
Customizing report data
To customize the data displayed in the report, use the lists at the top of the graph:
- Show funnels by – specify whether you want to view the report in All time, Week or Day view.
- Funnel – select the funnel for which you want to view data.
- Segment – select the user segment for which you want to view funnel data. It is interesting to view the progress of particular segments of the user base through funnels. It might highlight, for example, that users from a particular channel find a tutorial easier.
Additional actions
The following sections provide information about the additional actions you can perform on the Funnels screen.
Creating new funnels
You create funnels in Swrve simply by specifying a list of events in a specific order. Review the following guidelines before creating funnels in Swrve:
- Funnels only begin collecting data from the point in time at which they are created—funnels are not retroactive. For example, if you launch your app on the 1st, but create a funnel for a tutorial on the 5th, the data from the 1st to the 4th is not included in that funnel.
- You can create funnels using event names which have not yet been received by Swrve, but your development team must then instrument the named events in the app so that they are sent to the Swrve service during app usage. This enables Swrve to collect the events and report back on the funnel flow. Your development team uses the Swrve Events API to instrument events—for more information, see Swrve Events API guide.
- If the graph is empty for a funnel you have created, it is likely that the first step (event) in your funnel is not being triggered. To check this, access the Events report by selecting Events on the Analytics menu. If the event has a value of 0 for recent time periods, then it is not being received by Swrve. Check with your development team to confirm that the event is being sent properly.
- The first event used in your funnel must be sent to Swrve before any other event in your funnel and all subsequent events must also be sent in the correct order. If some of your funnel steps are not displaying in the funnel graph, it is likely that events are not being triggered in the right order. In this instance, check that you have correctly sequenced events when you created the funnel on the Funnel Creation screen. If you have correctly configured the event sequence, check with your development team to confirm that the events are being sent in the correct order.
To create a new funnel:
- Select Create a new funnel to access the Funnel Creation screen.
- In the Funnel Name field, enter the name of the funnel.
- Add the required funnel steps (events) by performing the following actions for each step:
- Select the event from the Event Name list.
- If your event contains custom payloads, optionally specify the payload key and payload value for the event and select Add Payload. For technical information about sending events to Swrve, see the platform-specific Integration guide.
- Select Add this step to the funnel.
- After you have added the required funnel steps, select Save this funnel.
Renaming selected funnel
To rename the currently selected funnel, select Rename currently selected funnel, enter a new name for the funnel, and then select Save this funnel.
Deleting selected funnel
To delete the currently selected funnel, select Delete currently selected funnel.
Saving report data in CSV format
To save the graph data in comma-separated values (CSV) file format, on the menu in the top right-hand corner of the chart, select Download CSV. The CSV file is downloaded to your local machine. To save the table data in CSV file format, below the table select Download as CSV.