Top five user lifecycle queries
Study the lifecycle of your users with the User Properties Database. Advanced users may also wish to import event data in addition to user property data. This article explores how you can determine user lifecycle for a typical app.
What is my average user lifetime?
The first step to exploring user behavior is finding out how long they stick around in your app. This helps you decide when to message them and when to A/B test them.
Use this simple query to determine how long the average user remains active in your app.
SELECT AVG(CAST(datediff AS float))
FROM (SELECT datediff(DAY,date_joined,last_active) AS datediff
      FROM swrve_properties)
Example result
6.8
Actions to take
Different apps have different lifespans. If your users have shorter lifetimes than expected though, we suggest a recurring push notification to users at risk of churning. For example, a push notification to all users who haven’t used the app in the last seven days can offer updates. Also, if a large number of your users appear to have trouble using your app, you can message them with specific help for their problem. For instance, target users who have fired media.record, but not media.share, with information on how to share their media.
For more information, see Intro to push notifications.
What is my lifetime breakdown?
Now that you’ve learned what the average lifespan of your users is, you can look deeper into your data. The below query shows how many of your users are active for one day, two days, less than a day, and so forth.
This query shows the distribution of users with different lifetimes. Some apps are sustained by a small core of highly dedicated users, whereas others have a large audience of casual users.
SELECT COUNT(1) AS "Users",
       lifetime
FROM (SELECT datediff(DAY,date_joined,last_active) AS lifetime
      FROM swrve_properties)
GROUP BY lifetime
Example result
| Users | Lifetime |
|---|---|
| 269480 | 0 |
| 142903 | 1 |
| 95092 | 2 |
| 67923 | 3 |
Actions to take
This can reveal the difference between users who are engaged with your app and those who merely tried it out and didn’t give it further thought. If you’re losing users early on, ensure your app’s benefits are immediately apparent, and test different onboarding strategies with a Swrve A/B test.
For more information, see Intro to resource A/B testing.
Funnels
Now that you have a sense of a user’s lifetime, look at points where they might be dropping off. Funnels are a great way to show how different users are moving through your app at different times, and where users might be reaching pain points causing them to leave the app. If you have a funnel consisting of event_01, event_02, and so forth, you can see how many users completed each step in the funnel with the below. Be sure to use your own event names in place of event_##, and add as many events as you like. Remember that funnels are useful for store flow, tutorials and general app progression.
SELECT funnel_steps_completed,
       COUNT(1) AS users
FROM (SELECT swrve_data_id,
             CASE
               WHEN event_01 > 0 THEN 1
               ELSE 0
             END +
             CASE
               WHEN event_02 > 0 THEN 1
               ELSE 0
             END +
             ... AS funnel_steps_completed
      FROM  events_fired)
GROUP BY funnel_steps_completed
Example result
| Funnel Steps | Users |
|---|---|
| 0 | 19283 |
| 1 | 18723 |
| 2 | 16487 |
| 3 | 15990 |
Actions to take
A substantial drop at any point in the funnel is a clear sign that something is wrong. Fortunately, an A/B test of your store, tutorial or any other part of your app can get things back in shape.
For more information, see Intro to resource A/B testing and Funnels report.
Analyzing multiple dimensions
The above queries are great for a general overview, but the real power of your user properties database lies in the ability to study your users by many attributes at once. The above queries can easily be modified to break down results by any combination of user properties, like timezone (a good subsitute for location) and device. The below example is for lifetime:
SELECT COUNT(1) AS "Users",
       lifetime,
       swrve_timezone_name
FROM (SELECT datediff(DAY,date_joined,last_active) AS lifetime,
             swrve_timezone_name
      FROM swrve_properties)
GROUP BY lifetime,
         swrve_timezone_name
ORDER BY lifetime,
         swrve_timezone_name
Example result
| Users | Lifetime | Timezone |
|---|---|---|
| 12987 | 0 | America/Los_Angeles |
| 10724 | 0 | Europe/London |
| 11923 | 1 | America/Los_Angeles |
| 12482 | 1 | Europe/London |
| … | … | … |
Actions to take
The above example indicates that lifetime is noticeably stronger for users on London time—something worth investigating! Your app might benefit from localization to other regions. You can target Swrve push notifications and in-app messages by multiple properties, so you can deliver tailored content to a very specific set of users who may need different calls to action or special information.
For more information, see Intro to push notifications and Intro to in-app messages.
Engagement and lifetime correlation
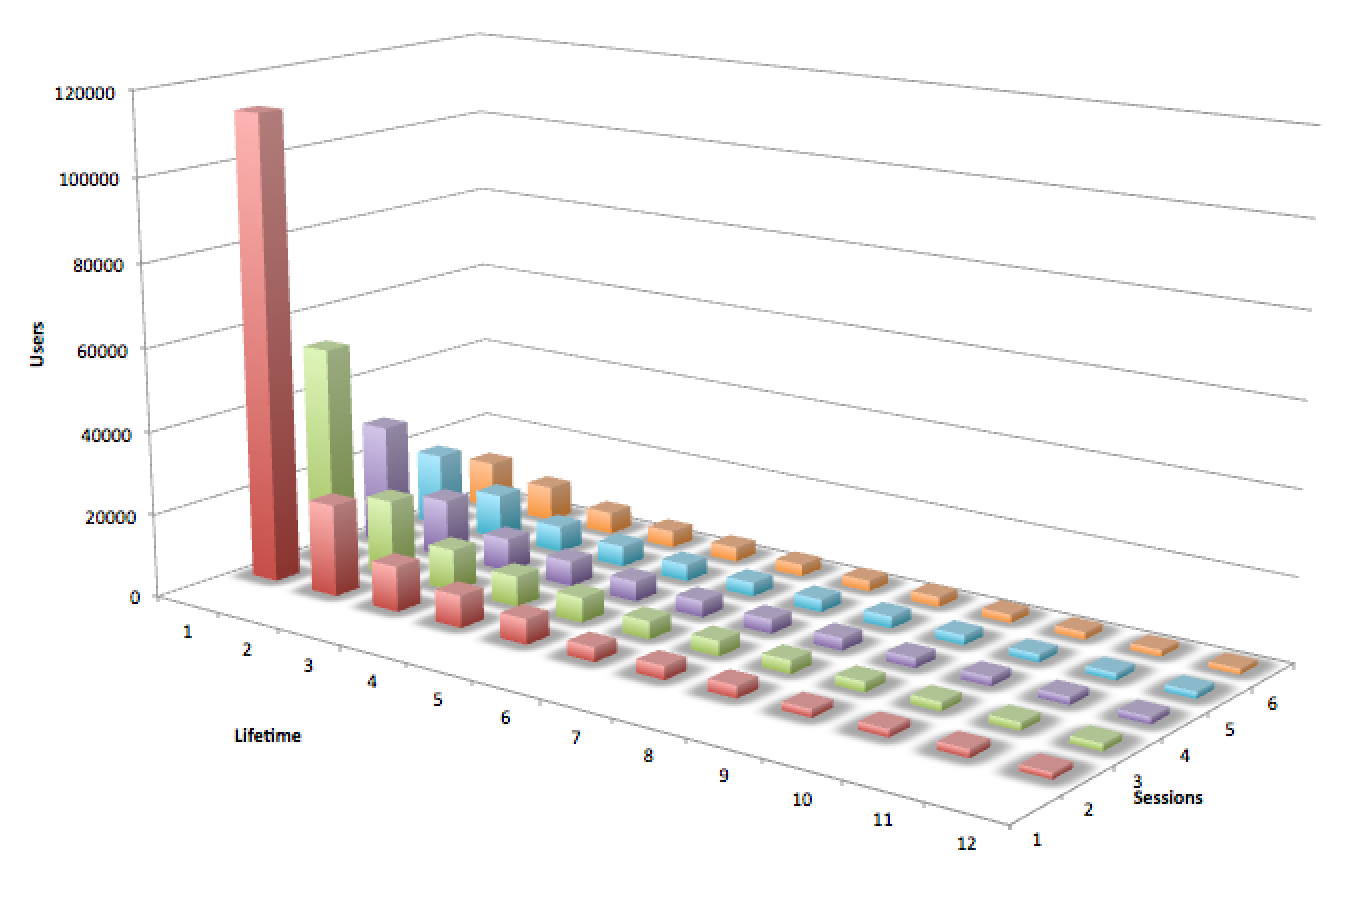
A lot of work goes into increasing user engagement, with the idea being that users who use the app more will stick around longer. Do people who’ve started five sessions spread them over several days, or use the app heavily in the first day or two? This query reveals whether that’s actually the case.
SELECT COUNT(1) AS "Users",
       lifetime,
       swrve_session_start
FROM (SELECT datediff(DAY,date_joined,last_active) AS lifetime,
             swrve_session_start
      FROM (SELECT *
            FROM swrve_properties
              JOIN events_fired USING (swrve_data_id)) swrve_properties)
GROUP BY lifetime,
         swrve_session_start
ORDER BY lifetime
Example result
| Users | Lifetime | Sessions |
|---|---|---|
| 25697 | 1 | 2 |
| 23495 | 2 | 2 |
| … | … | … |
| 15295 | 4 | 5 |
| 10298 | 5 | 5 |
| 5978 | 6 | 5 |
| 2659 | 7 | 6 |
Since all combinations of user lifetime and sessions are considered, it can be helpful to chart this along three axes by putting the data in a spreadsheet. The resulting chart might look like this—keep in mind that only users with at least two sessions will have a lifetime to report.
Actions to take
The results in this example indicate that most of this app’s users have a lifetime of a few days or less. Interestingly, longer lifetimes are only loosely correlated with greater engagement. This app clearly needs to accomplish its goals quickly, so marketing campaigns early in the user lifecycle and a recurring push re-engagement campaign are called for.
For more information, see Intro to push notifications and Intro to in-app messages.
Most Swrve customers can self-host this pipeline; all you have to do is follow the steps in these tutorials. However, if you prefer a turn-key hosted solution, we do offer one as a professional service. There is an additional fee associated with this service. For more information, contact your CSM at support@messagegears.com.
Swrve support can help you with basic setup and configuration of the pipeline described above. If you need help with your queries, contact our Data Services team at support@messagegears.com. They will help you get the most out of your data with dedicated support, pre-built and custom reports, and dedicated data science hours.