User attributes report
View a snapshot of your users in both graphical and tabular format with the User Attributes report. For example, view the lifetime spend, the lifetime minutes spent in the app, the app version and the location of all your users for a particular user segment.
To access the User Attributes report, on the Analytics menu, select User attributes.
You can perform the following actions to customize the data displayed in the report:
- Select the user attribute on which the graph is based.
- Select the user segment for which you want to view data.
- Select the number of values displayed on the X-axis.
In addition, you can perform the following actions on the User Attributes screen:
- Print the report.
- Save report data in CSV file format.
The following image shows an example of a typical user report:
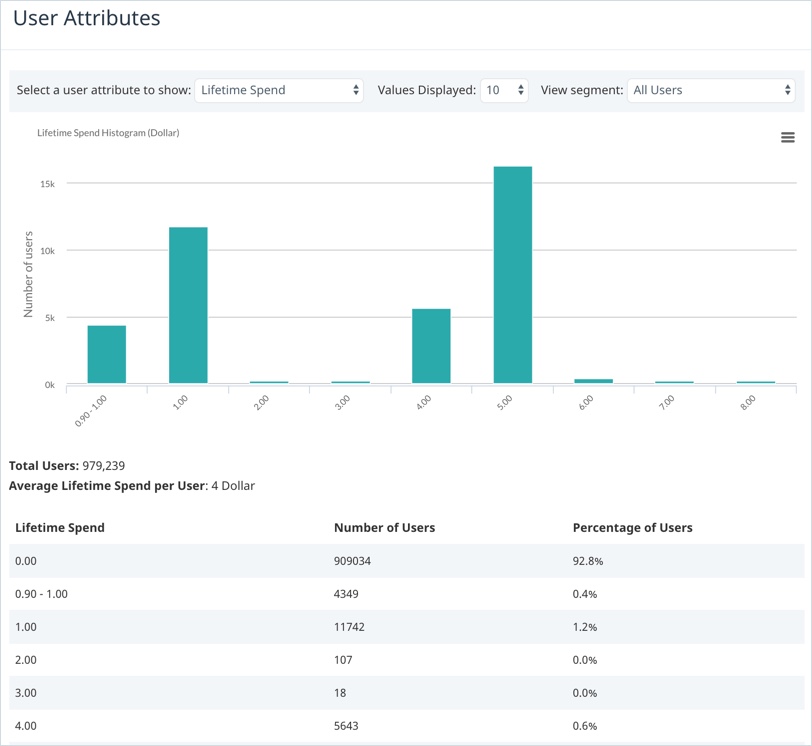
The X-axis displays the attribute value, such as the lifetime spend.
Data point markers on the chart enable you to view specific data for a particular attribute; placing your cursor on any data point marker on the chart displays a tooltip which details the number of users with the particular attribute value. You can also read this data in the table below the chart.
For information about the data source for this report, see What is the data source for the user attributes report?
Customizing report data
To customize the data displayed in the report use the filter lists at the top of the chart.
- Select a user attribute to show – select one of the user attributes to be included in the results:
- Lifetime spend – the total amount of money spent by each user.
- Lifetime minutes in app – the total number of minutes that the user has spent in the app.
- App version – the most recent version of your app that each user has used.
- Level – an increasing integer that represents the game level or progress through the app.
- Age, Gender or Location
- Values Displayed – select the number of attribute values displayed in your results.
- View segment – select the user segment for which you want to view user data.
Additional actions
The following sections provide information about the additional actions you can perform on the User Attributes report.
Printing reports
To print a user report, on the menu in the top right-hand corner of the chart, select Print. Depending on the type of browser you are using, the print screen or print dialog box displays. Define your required print settings and print the report.
Saving report data in CSV format
To save the report data in comma-separated values (CSV) file format, on the menu in the top right-hand corner of the chart, select Download CSV. The CSV file is downloaded to your local machine.
Data source
The lifetime spend, lifetime minutes in app, and app version data on the User Attributes screen is calculated automatically for you by Swrve. The other attributes (level, age, gender and location) must be supplied by your development team to Swrve during your Swrve integration process.