Item Charts report
The Item Charts screen enables you to track the performance of items in terms of the number of items sold and the currency spent. You can track items individually or by group (item filter) and you can select a particular user segment or currency for which you want to view data. By monitoring items, you can do the following:
- Identify trends in sales of a particular item; for example, peaks during certain periods or a drop-off in sales over time.
- Compare sales of different items over time.
- Compare real currency and virtual currency item sales.
- Use the Item Charts graph data to plan in-app messages or push notifications. For example, you might notice that sales of a particular item are high when you first launch the item but that sales drop-off after a certain period. In this instance, you could time an in-app message to remind users about the item and revive sales. For more information about in-app messaging in Swrve, see Intro to In-App Messages. For more information about push notifications, see Intro to Push Notifications.
- Identify items that would make good candidates for resource A/B testing. For example, if an item is generating a significant amount of sales, you could investigate the effects of an increase in price by performing a resource A/B test. For more information about resource A/B testing in Swrve, see Intro to Resource A/B Testing.
Swrve tracks item sales in real currency by means of IAP events and those in virtual currency by means of purchase events. For technical information about sending events to Swrve, see the platform-specific Integration Guide.
To access the Item Charts screen, on the Reports menu, select Item Charts. The following image shows an example of a typical Item Charts report:
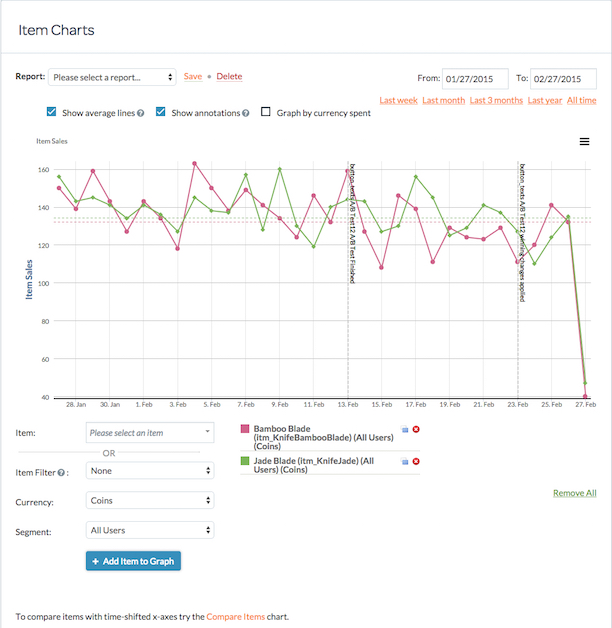
The report displays a graph of the number of items sold or the currency spent on a particular item for the selected time period.
You can perform the following actions to customize the data displayed on the Item Charts screen:
- Define the time range for which the data is generated.
- Define the graph settings.
- Select and remove the items or item filters included in the graph and filter items by currency and segment.
In addition, you can perform the following actions on the Item Charts screen:
- Create new reports.
- Delete existing reports.
- Print the graph.
- Save the Item Charts graph data in CSV file format.
Customizing Item Charts data
The following sections provide information about how to customize the data included in your Item Charts report.
Defining the time range
There are two options for defining the time range:
- In the From and To calendar fields, manually enter the dates for the time range.
- Select a set time range (Last week, Last month, Last 3 months, Last year or All time).
Defining Item Chart graph settings
To define the graph settings, select or clear the following check boxes:
- Show average lines – select if you want to display the average values of all visible data points in the graph.
- Show annotations – select if you want to display user-defined annotations in the graph. An annotation is a vertical line that on the graph that indicates a significant event such as the start of a campaign. For information about creating annotations, see Intro to Analytics.
- Graph by currency spent – select if you want the Y-axis of the graph to represent currency spent instead of the number of items sold (the default value).
Adding data to the Item Charts graph
To add data to the graph:
- Select one of the following:
- A single item from the Item list, or
- An item filter from the Item Filter list. Item filters are sub-sets of grouped items. You define item filters on the Resources screen. For more information about defining item filters, see Intro to Analytics.
- In the Currency list, select the real currency (USD) or the virtual currency for which you want to view data for the selected item or item filter.
- In the Segment list, select the user segment for which you want to view data for the selected item or item filter.
- Select Add Item to Graph. The data is added to the graph and each data item is listed as a color-coded link below the graph.
Removing data from the Item Charts graph
Each data item that you have added to the graph displays as a color-coded link below the graph. You can perform the following actions to remove or isolate data items within the graph:
- To remove a particular data item from the graph, select the x to the right of the color-coded link.
- To remove all data items from the graph, select Remove All.
- If the graph contains multiple data items, you may want to isolate a particular data item in the graph and hide the other data items. To do this, select the icon to the right of the data item. To show the hidden items and return to the previous view, select the icon again.
Additional actions
The following sections provide information about the additional actions you can perform on the Item Charts screen.
Saving new reports
To save a new report:
- In the Report list, select an existing report that you want to use as the basis for the new report. If no previous reports have been created, the Report list is empty. In this instance, proceed to Step 4.
- Customize the data displayed in the graph as required.
- Next to the Report list, select Save.
- In the Save Report dialog box, enter a name for the new report into the Report Name box.
- Select Save to save the report. The new report is now available in the Report list.
Deleting existing reports
To delete an existing report:
- In the Report list, select the report you want to delete.
- Select Delete. The report is no longer available in the Report list.
Printing the Item Charts graphs
To print graph data, on the menu in the top right corner of the chart, select Print. Depending on the type of browser you are using, the print screen or print dialog box displays. Define your required print settings and print the Item Charts graph.
Saving Item Charts data in CSV format
To save graph data in comma-separated values (CSV) file format, on the menu in the top right-hand corner of the chart, select Download CSV.