How do I calculate Lifetime Value (LTV)?
Lifetime Value (LTV) refers to the long-term value of your app users. LTV is a complex topic that has a number of components and different organizations have a variety of ideas about how to interpret the LTV of their users. This article provides information about how Swrve can help you to calculate your LTV.
Average LTV
Typically, you want to find out how much money you made on a particular user or group of users—you want to know the value of the user in the long term. If you spend a certain amount of money to acquire a user, you want to be certain that the user will make you money. Otherwise, it doesn’t make sense to continue spending on their acquisition.
The Return per install column in the User Acquisition report is very useful in this regard. This column displays the sum of the revenue minus the cost for all users in a user acquisition channel. This data enables you to gain insight into the relative performance of acquisition channels from a revenue perspective. For more information about the User Acquisition report, see User acquisition report.
Predictive LTV
Companies in the mobile and app space are typically interested in predictive LTV. Predictive LTV models are generally created from a retention model (curve) and a monetization model (curve). As there are so many variables in this predictive LTV calculation, Swrve does not provide a single predictive LTV figure, but instead provides the building blocks for calculating predictive LTV that you can use to understand how your users are performing in terms of LTV.
The key building blocks to help you calculate your predictive LTV are the retention curves and revenue curves in the User Cohorts report. For more information about this report, see User cohorts Report.
Example
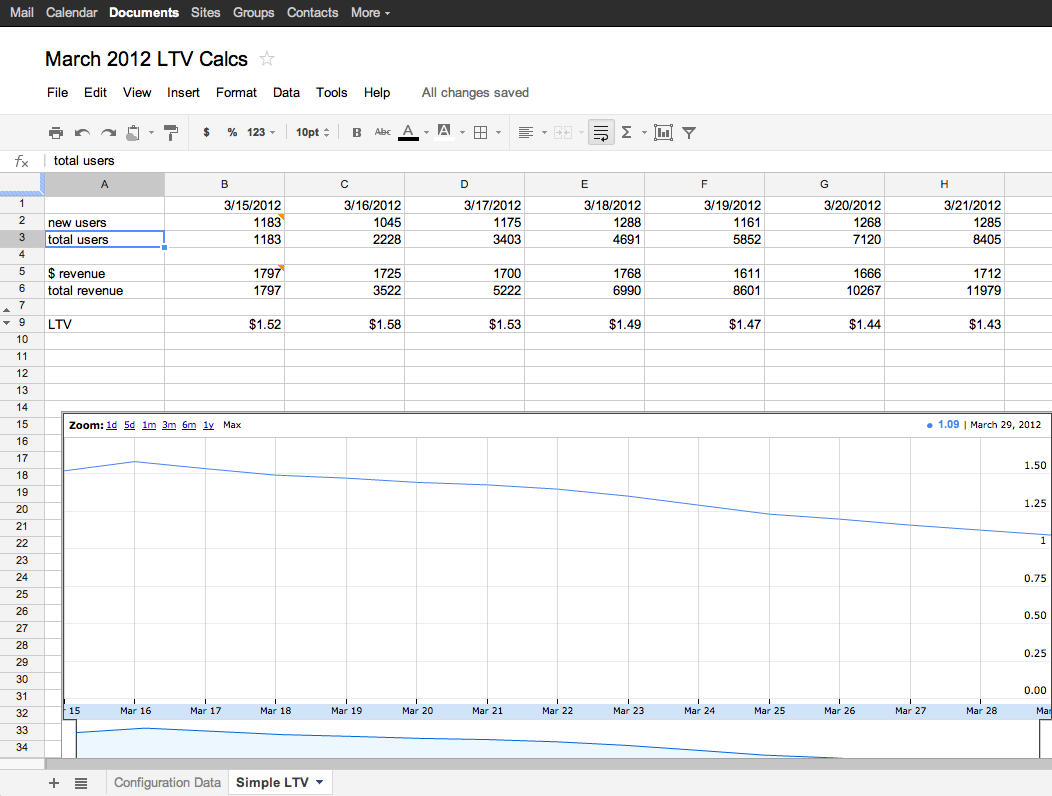
This example takes a simple definition of LTV: the amount of revenue you earned per user (ignoring future predictions). To calculate this figure for a particular segment, you need the following:
- The total revenue for that segment.
- The total users for that segment.
Export these figures using the Swrve Export API’s new_users and dollar_revenue metrics. The LTV (and the LTV trend graph) is the division of these numbers. For more information about exporting Swrve’s KPI data, see the following articles:
- How do I export Swrve KPI data into Google Spreadsheet using API?
- How do I export Swrve KPI data into Excel using API?
LTV calculation steps
Step 1: Export the new_users and dollar_revenue for the relevant segment for the lifetime on your app.
Step 2: Sum these values to get the total number of users and the total revenue.
Step 3: Divide these numbers to get the LTV for your users.
In Google docs:
- If your app is configured for:
- US data storage
=ImportHtml(“https://dashboard.swrve.com/api/1/exporter/kpi/new_users?only_data=true&api_key=&personal_key= &start=”, “table”, 0) - EU data storage
=ImportHtml(“https://eu-dashboard.swrve.com/api/1/exporter/kpi/new_users?only_data=true&api_key=&personal_key= &start=”, “table”, 0)
- US data storage
- =SUM(RANGE)
The example above exports data for the All Users segment. If you want to export this data for another segment just add “segment=” to the query above. This enables you to query LTV information for users from a particular location or with a particular trait (such as whales).
Using current LTV for LTV prediction
Starting with the example data above, use Swrve’s retention KPI data to make predictions relating to the lifetime of your users. Export day-1 through day-30 retention information using the Export API. For the sake of simplicity, it makes more sense to use only a few of these data points for the segment of those users in which you are interested. For example, you can make a good prediction of the lifetime of your users using the day-1 and day-7 retention KPIs. You can then multiply this data by your previous LTV figure.