About User Lifecycles
The default user state definitions are:
| User state | Description |
|---|---|
| New | Includes users who only used the app once, within the last seven days. |
| Evaluating | Includes users who used the app more than three times, and were active within the last seven days. |
| Engaged | Includes users who used the app once, but weren’t active between 8 to 30 days ago. |
| Bounced | Each lifecycle card provides information for new, evaluating, engaged, bounced, lapsing, and disappeared users. |
| Lapsing | Includes users who used the app multiple times, but were last active between 8 and 30 days ago. |
| Disappearing | Includes users who used the app one or more times but were last active between 31 and 60 days ago. |
You can customize the definitions of the user states in the User Lifecycle Settings screen. The user lifecycle tracks three parameters:
- The time frame of your Active User Base (defaulted to 30 days).
- The time frame of recently active users (defaulted to seven days).
- The criteria for user engagement (defaulted to at least three sessions).
User Lifecycle dashboard
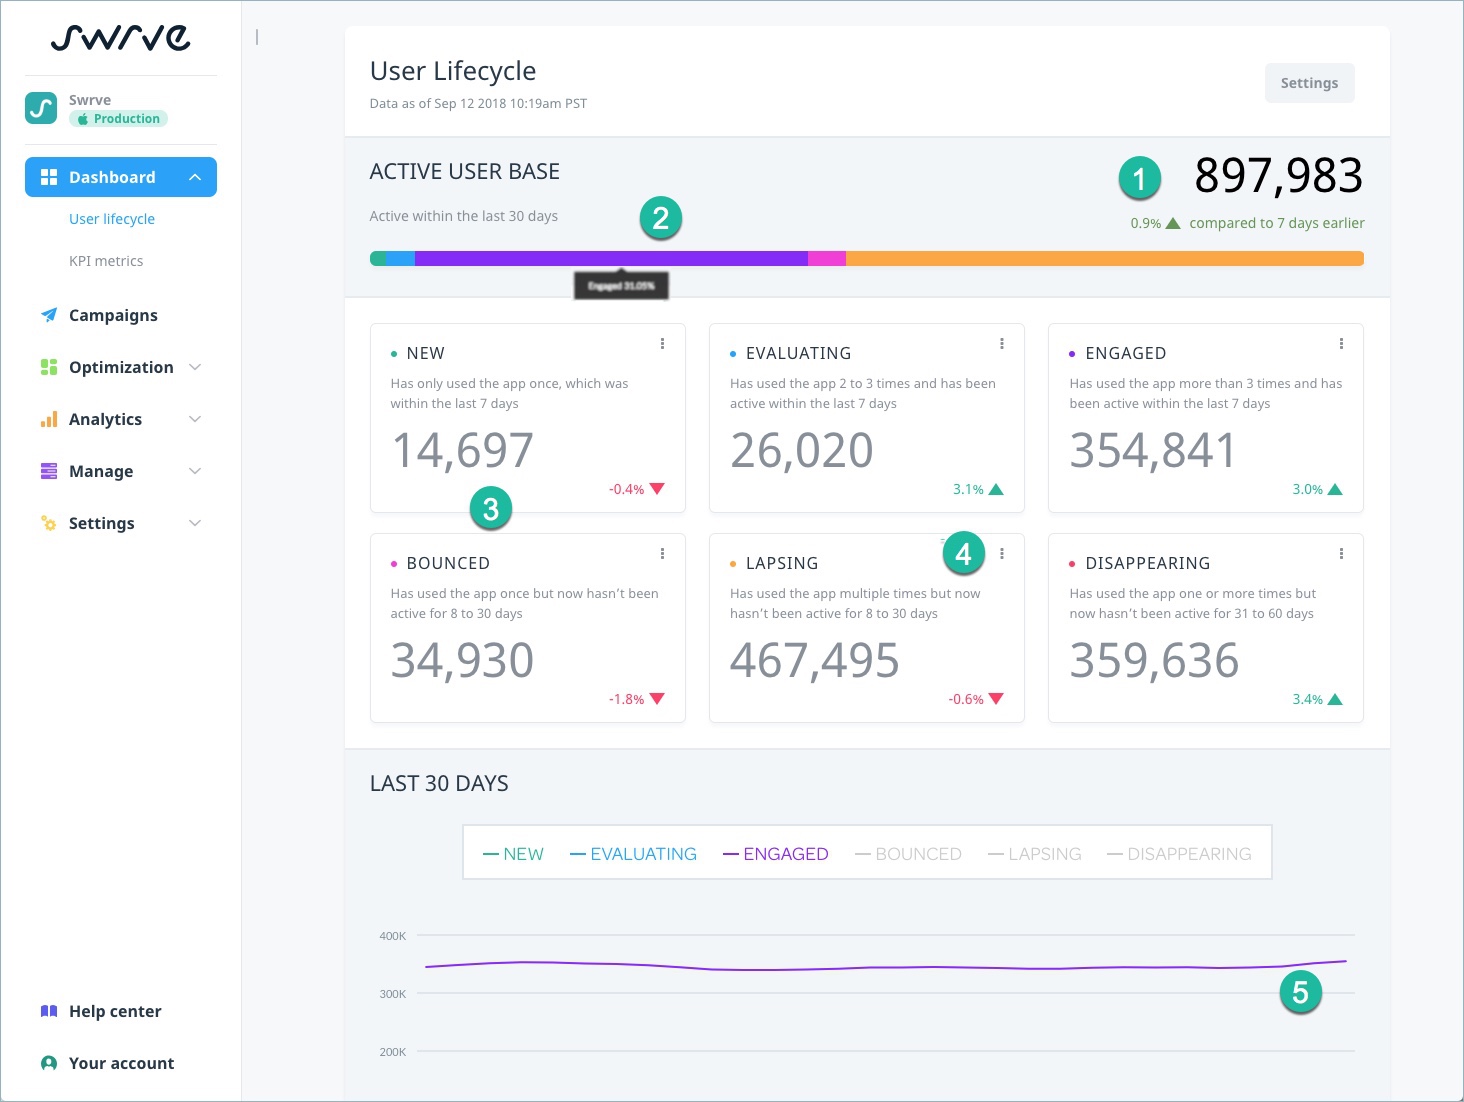
The User Lifecycle dashboard consists of the following major sections:
- Active User Base – displays the total user count and percentages for your active user base time frame—that is, the number of users in new, evaluating, engaged, bounced, lapsing or disappearing states.
- User Lifecycle Cards – displays details for each of the user states, in particular, the number of users currently in each state of the lifecycle.
- 30 Day View – displays a line graph of the changes to each user state over the last 30 days. By default, the graph displays only the active states; however, you can select any of the other user states to include its metrics in the graph.
| Element | Description | |
|---|---|---|
| 1 | Active user base | The figure displayed is the number of active users. |
| 2 | Percentage breakdown | Hover over the colored sections of the bar to see what percentage a particular user base contributes to your total users figure. |
| 3 | The lifecycle targeting menu | All of the cards have a lifecycle targeting menu. See Lifecycle targeting for more information. |
| 4 | User lifecycle cards | Each lifecycle card provides information for new, evaluating, engaged, bounced, lapsing, and disappeared users. |
| 5 | 30 day view | This is a visual representation of the previous 30 days activity. |
Active User Base
The Active User Base section of the screen displays the total number of active users, the change in the active user base over a selected time period, and the percentage breakdown of each user state (except disappearing). Hover over the colored sections of the bar to view the percentage breakdown of each state.
User lifecycle cards
The details of each user state are displayed on six ‘cards’. Each card shows the definition of each state, the number of users in that state and the change over the selected time period. Changes are represented by a percentage value and an arrow that indicates if the number has increased or decreased. Each card also includes a menu that enables you to target the users in that state with an in-app message or push notification campaign.
The numbers that display for each state reflect the total number of users who match the criteria. The data is refreshed on a daily basis. This is not a daily active user (DAU) or monthly active user (MAU) count, but a total user count as of the time and date displayed beneath the Active User Base title. By default, each card also displays the percentage change from seven days ago; however, you can change this on the User Lifecycle Settings screen to compare against 30 days ago or 24 hours ago.
Lifecycle targeting
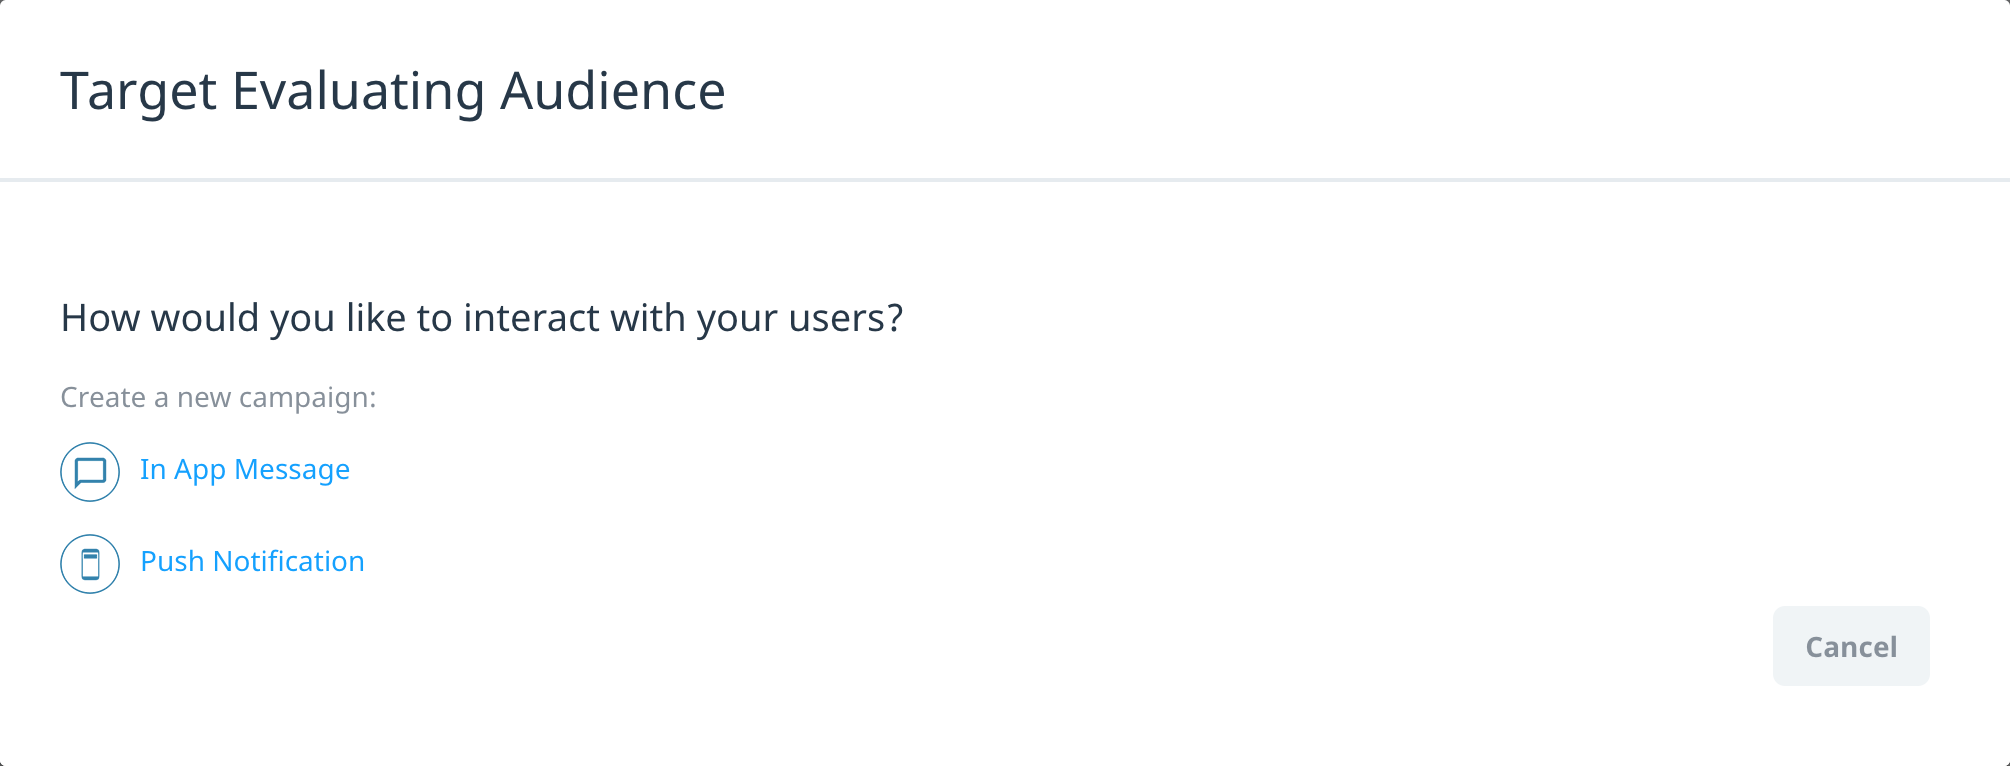
To target users within a lifecycle state:
Step 1: On the relevant lifecycle card, select the menu icon.
Step 2: Select the type of campaign you would like to create:
Step 3: Complete the Overview and Add Content screens for the campaign workflow of choice. For more information on how to create each campaign type, select one of the links below:
Step 4: On the Set Target screen of the workflow, the selected lifecycle state is automatically included as one of the Define Target Audience filters. To create additional audience filters, select the Custom Audience tab and then select the type of data and related filters and operators you want to base your filter on. For detailed information on the data types and filter descriptions, see Segment and audience filters.
Step 5: Set the message display triggers and campaign goals as required then select Save as Draft: Preview & Test to proceed.
Step 6: On the Preview & Test screen, QA test and schedule or launch the campaign as required.
The saved campaign is displayed on the Campaigns overview screen, from which you can view the campaign results or manage the campaign. For more information about reports for specific channels, see Campaign reports.
30 Day view
The Last 30 Days section includes a line graph that displays the change in user state counts over the last 30 days. By default, only the three active states are displayed (new, evaluating, engaged); however, you can select data from any user state to display on the graph.
User lifecycle settings
The User Lifecycle Settings screen enables you to view and edit the definitions for your user activity.
Editing user lifecycle settings
To edit user lifecycle settings:
Step 1: On the User Lifecycle dashboard, select Settings.
Step 2: On the User Lifecycle Settings screen, edit the following settings as required:
- Active User Base – enables you to select the time period that you define your users as being active. The default is 30 days but you can change this to 60 or 90.
- Recently Active – enables you to select a time period that you define as recent activity. The default is 7 days but you can change this to 5, 9 or 14.
- Engagement Type – enables you to select whether user engagement is measured by the Number of Sessions the user has had, or the Time in App.
- If you select Number of Sessions, select the number of sessions (3, 4, 5 or 6) after which you consider a user to be engaged.
- If you select Time in App, select the number of minutes in app (5, 15, 30, 60 or 90) after which you consider a user to be engaged.
- Churn – enables you to set the period after which you consider a user to be inactive. The default is 2x the number you selected for your Active User Base (for example, Active User Base equals 30 days, Churn equals 60 days) but you can change this to 1.5x, 3x or 4x.
- View Settings – enables you to select the time period for calculating the changes in your user base. The Compare To default is 7 days earlier but you can change this to 24 hours or 30 days.
The User Lifecycle Definitions section automatically updates to display the new definition of each state.
Step 3: To save your changes, select Save.
Step 4: You are prompted to confirm the changes. Changes can take up to 24 hours to be reflected on the lifecycle dashboard. Select OK to proceed.