Campaign reports
Swrve’s Campaign center has two options for viewing your campaign results. Use the available filters to customize your campaigns view, for example, by state or channel.
- High-level overview – In the Campaigns center, the campaign card displays high-level metrics for a campaign, such as audience and engagement. To expand the campaign summary card and view additional metrics, select View metrics
 .
. - Detailed report – On the builder page for a specific campaign, to view the detailed campaign report, select View Report.
This article mainly covers the campaign channels that use the consolidated campaign workflow. For information on the campaign channels that are not mentioned below, see the following articles:
Campaign report
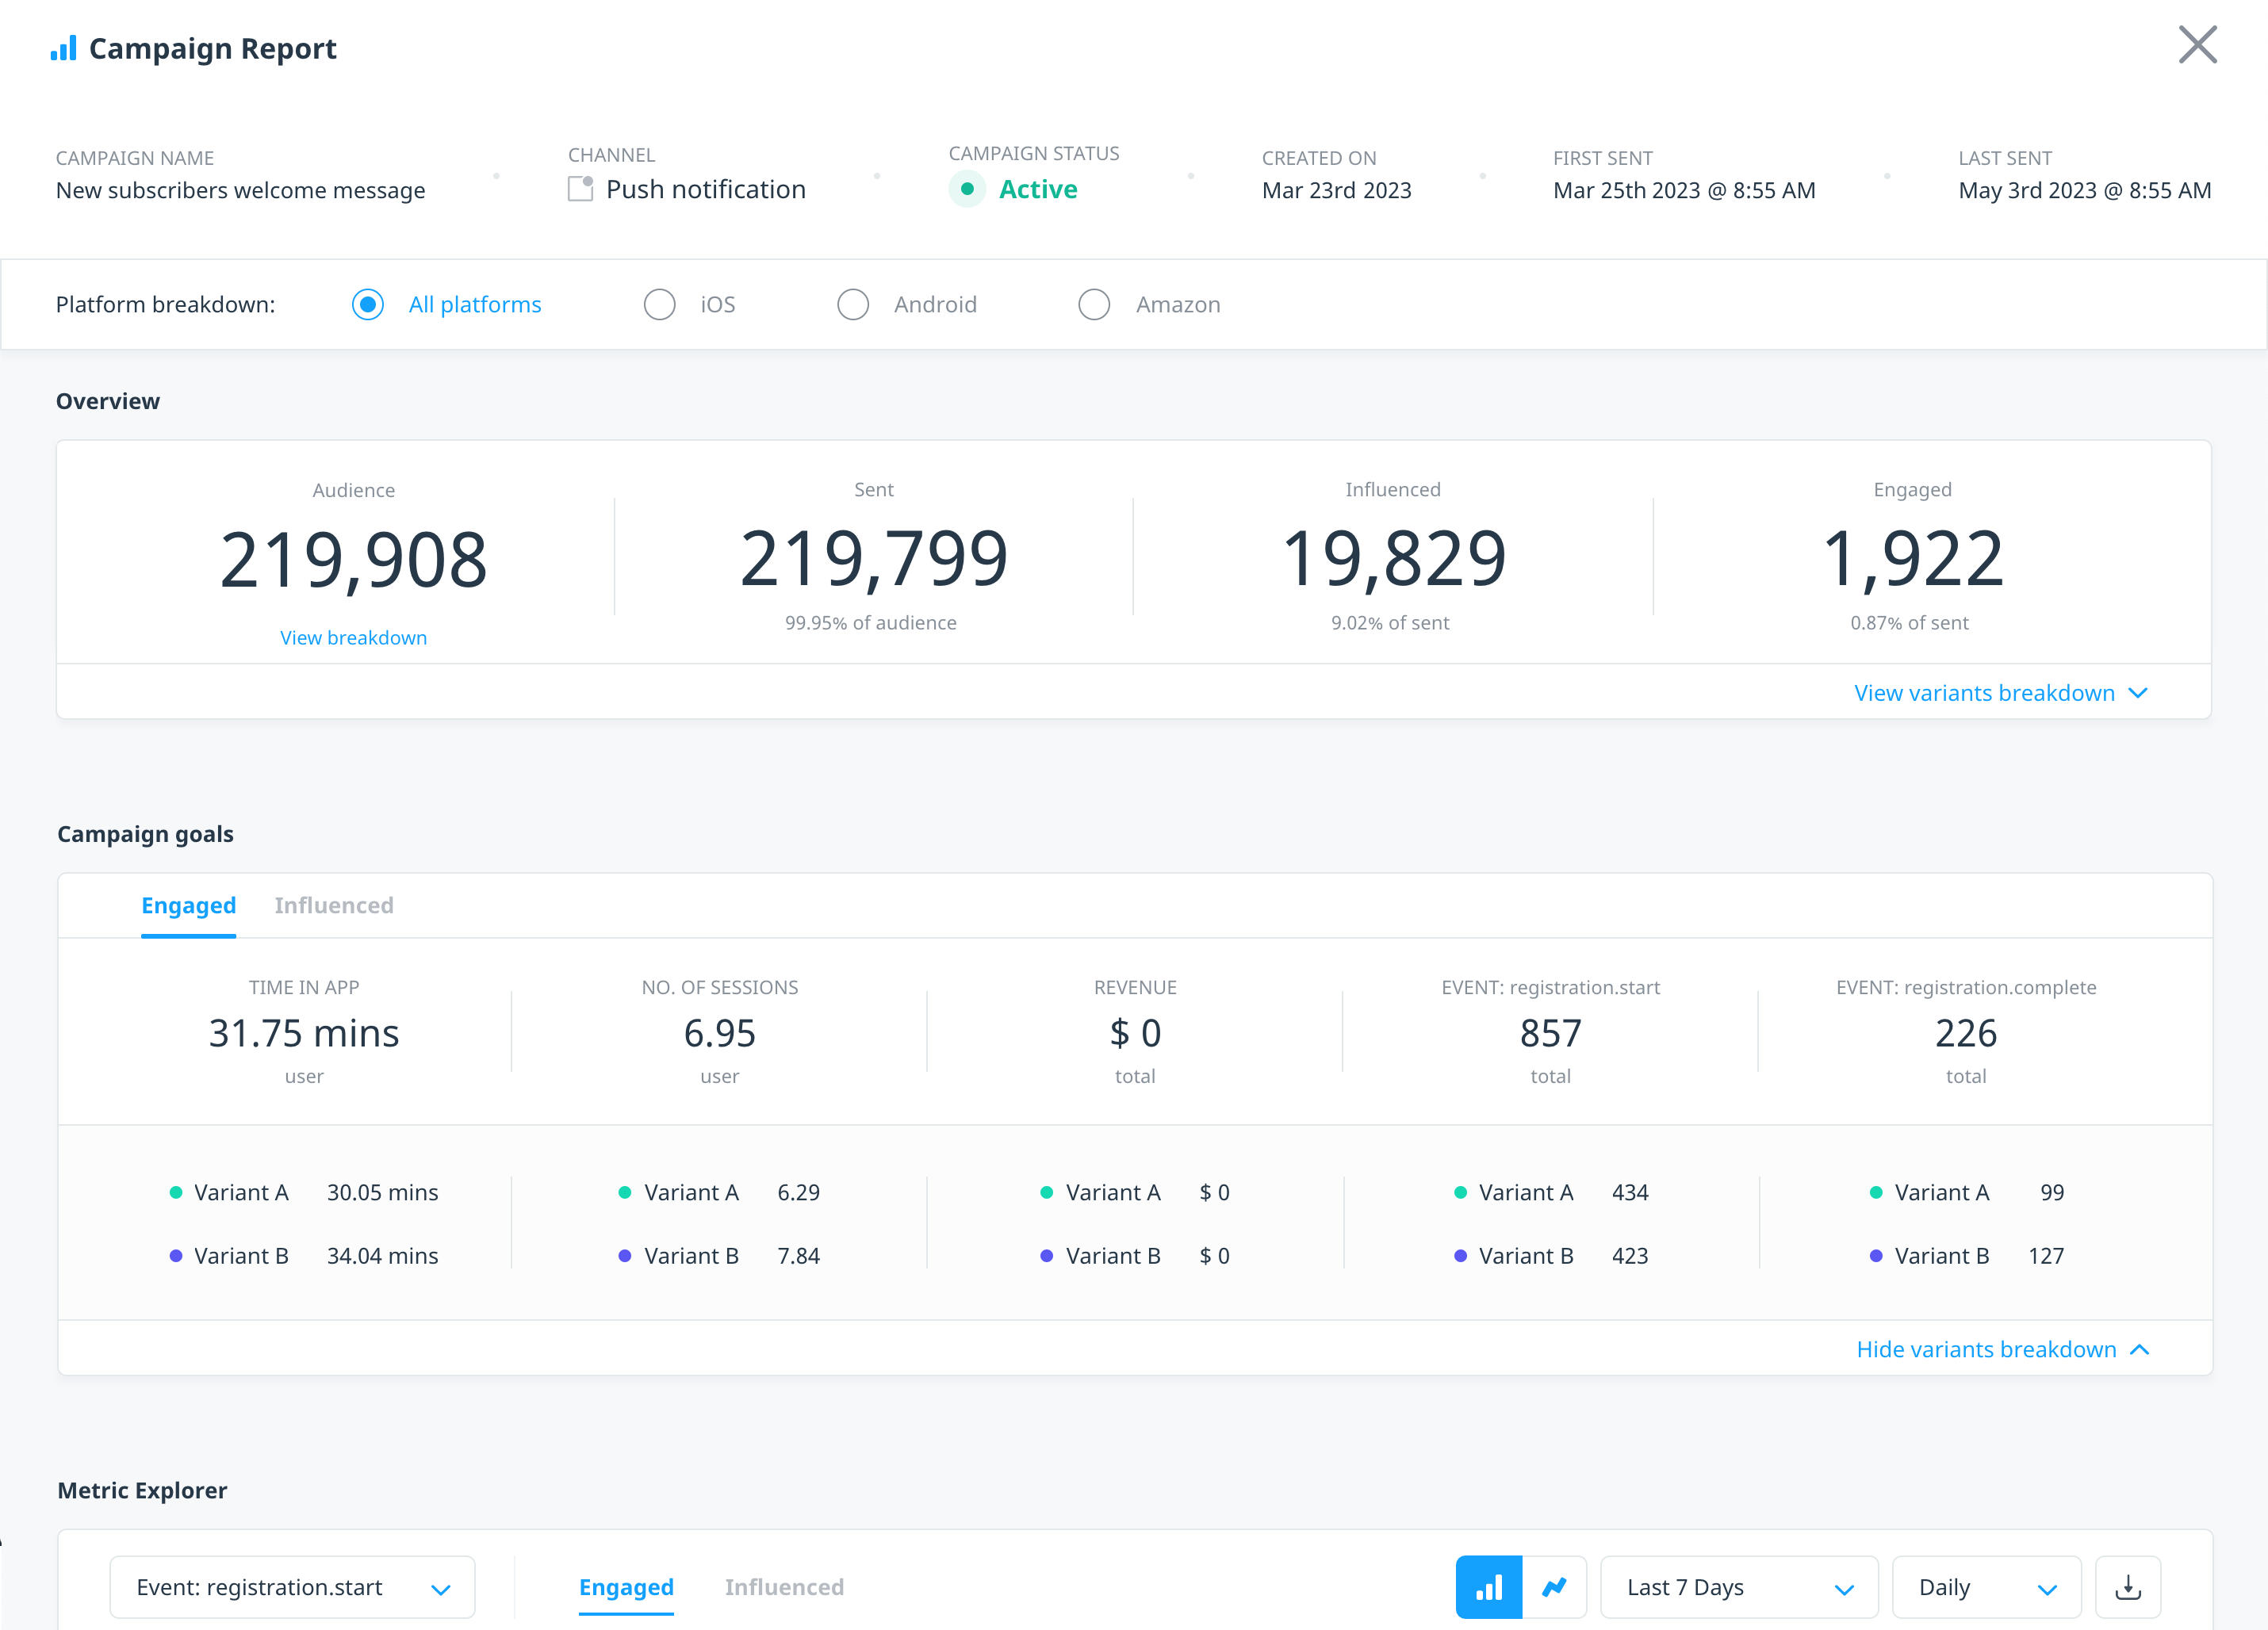
The Campaign Report screen displays campaign details and channel-based metrics for your campaign results. It also displays Swrve’s default tracking metrics and results for any custom goals you selected when creating the campaign.
The campaign report is divided by Summary and Page & button clicks, which are accessed from the tabs below the campaign details section.
Campaign details
The report header displays general campaign information, depending on the channel:
- Campaign name: The name given to the campaign.
- Channel: The campaign delivery channel.
- Campaign status: The current status of the campaign. For more information about the different campaign states, see Managing your campaigns.
Push - Scheduled & Quick
- Created on: The date the campaign was created.
- First sent: The date and time the campaign was first sent.
- Last sent: The date and time the campaign was last sent if a recurring campaign.
Push via API
- Created on: The date the campaign was created.
- Last sent: The date and time of the last push notification that was sent for this campaign.
In-app message & Embedded
- Updated on: The date the campaign was last updated.
- Start Date: The start date of the campaign.
- End Date: The end date of the campaign.
Overview
The Overview row of the report displays totals for the campaign performance funnel, from the start of the campaign. If relevant, it might also include further technical details about the campaign results. To view the additional details, select View breakdown under the audience total.
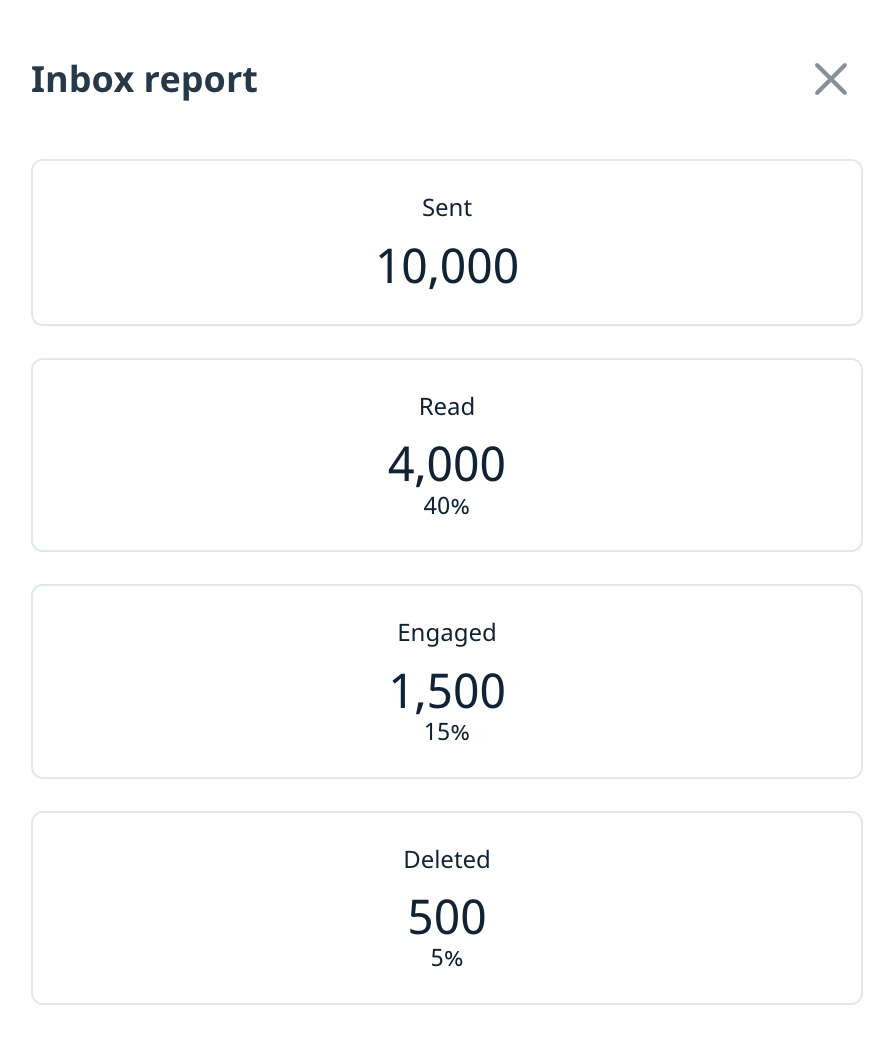
If the push notification campaign includes an inbox message, select View inbox report.
To view metrics for each campaign channel, select the related tab.
Push - Scheduled & Quick
The Overview metrics for scheduled and quick push campaigns are the same. For recurring scheduled push campaigns, the numbers represent the accumulated totals since the start of the campaign.
- Audience: The total number of your targeted users who were eligible to receive the push notification.
- Sent: The total number of users to whom Swrve sent the notification, and it wasn’t rejected by the push provider.
- Influenced: The total number of users who didn’t directly engage with the notification but opened the app within a 12-hour window after the push notification was sent.
- Engaged: The total number of users who engaged with the push notification.
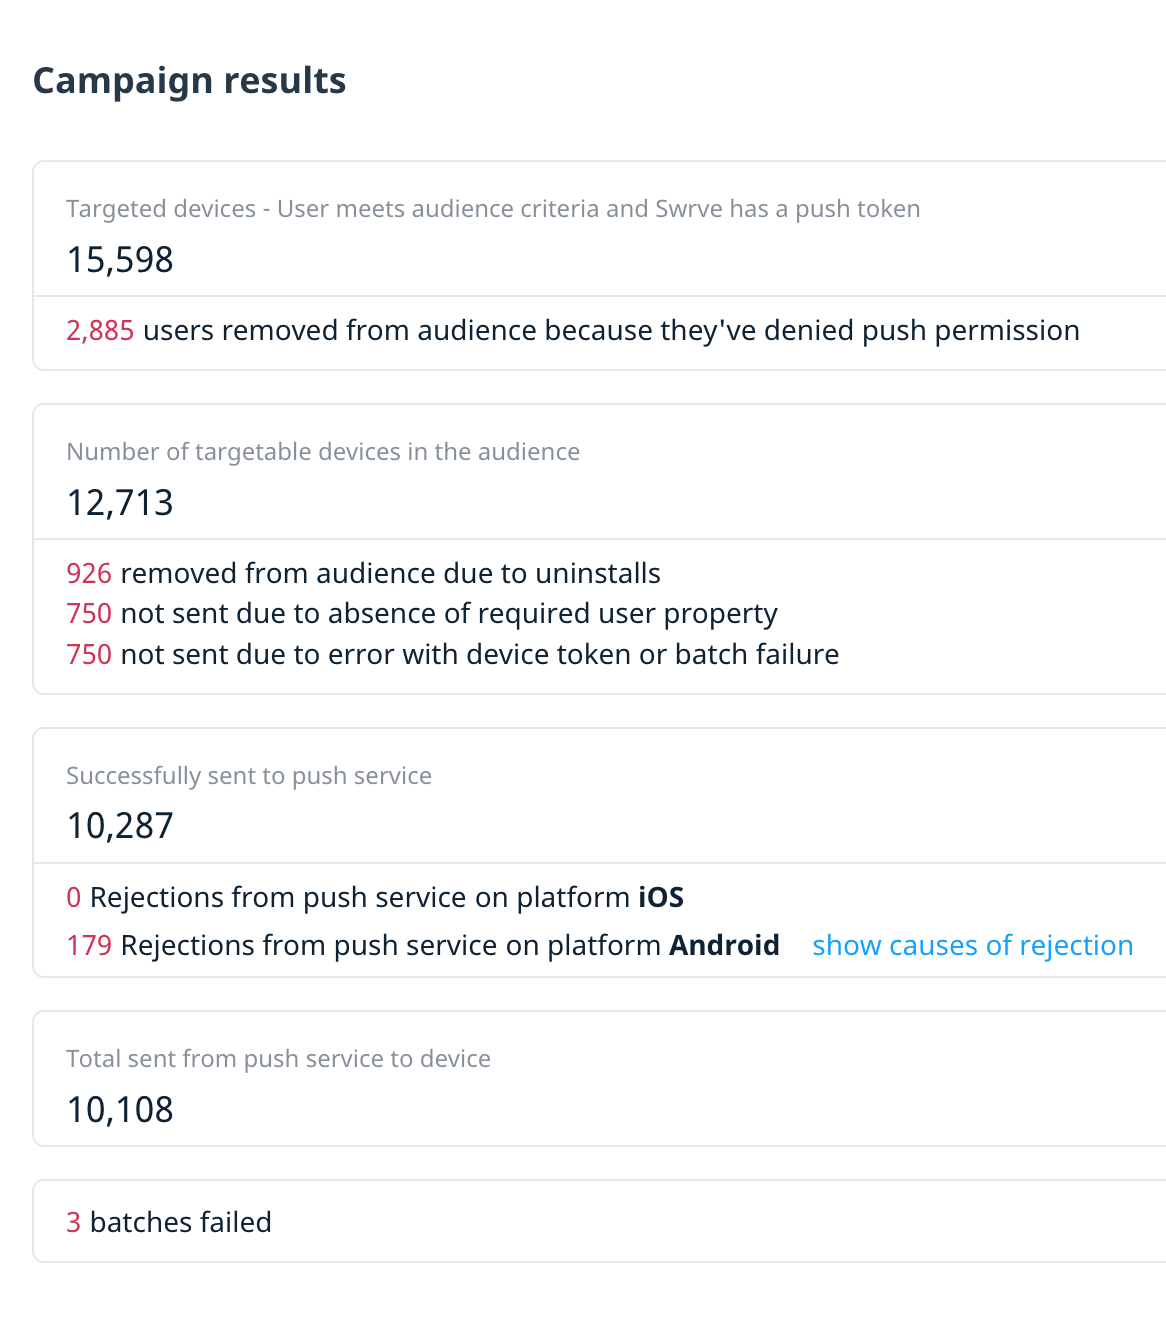
Campaign results:
- Targeted devices: The number of user devices that met the campaign’s audience criteria and have a push token.
- N user’s removed from audience because they’ve denied push notifications: The number of user devices with a push token but have denied push notification permission.
- Number of targetable devices in audience: The number of user devices that qualified for the push notification (that is, the number of devices with a device token for the platform(s) of your app who have granted push notification permission).
- N devices were not sent push due to app uninstalls: The number of devices that were not sent the push notification because the app was uninstalled prior to the push.
- N devices were not sent due to absence of required user property, where no default value was specified: The number of devices that could not be sent a personalized push message, since the message included a user property reference with no fallback option, and the user did not have a value set for that user property.
- N push notifications failed to send: The number of device tokens for which an error occurred in the push notification batch job, preventing them from being sent to Apple or Google.
- Successfully sent to push service: The number of user devices that qualified for the push notification and were processed by Swrve’s push notification batch job.
- N rejections from push service: The number of device tokens immediately rejected by Apple or Google (due to token invalidity, for example). To view the error message returned by Apple or Google for each rejected device token, select show causes of rejection.
- Total sent from push service to device: The total number of users to whom Swrve sent the notification, and it wasn’t rejected by the push provider.
- N batches failed: Swrve sends push notifications in batches of 10,000 users at a time. If something goes wrong when sending a batch and the entire batch fails, displays the number of failed batches.
Push - Via API
- Audience: The total number of users who were eligible to receive the push notification, as determined by the user IDs included in your Push API call. A user might receive the same message more than once, so this number represents the total number of times the push was received, rather than the unique number of users.
- Sent: The total number of users to whom Swrve sent the notification, and it wasn’t rejected by the push provider.
- Influenced: The total number of users who didn’t directly engage with the notification but opened the app within a 12-hour window after the push notification was sent.
- Engaged: The total number of users who engaged with the push notification
Campaign results:
- Total push API requests: The total number of attempted calls to the Swrve Push API.
- N push notifications failed to send: The total number of push API requests that could not be sent to the push service.
- N requests failed due to rate-limiting: The number of push API requests that could not be sent due to the app sending too many requests per second and exceeding Swrve’s API rate limits.
- N requests failed due to message text being too large: The number of push API requests that could not be sent due to the message text exceeding the size limit of 4 KB.
- N requests failed due to a missing message: The number of push API requests that could not be sent due to the message not including body text.
- N requests failed due to no push token: The number of push API requests that could not be sent due to no push device token existing for the user ID. This might be because the user hasn’t been prompted to accept push notifications or they opted out of receiving push notifications from your app.
- N requests failed due to unknown external_user_id: The number of push API requests that could not be sent due to Swrve not recognizing the external user ID. Check that the ID you’ve provided is correct.
- N requests failed due to the campaign not being active at the time of request: The number of push API requests that could not be sent due to the campaign not being active when Swrve received the request.
- N devices were not sent push due to app uninstalls: The number of devices that were not sent the push notification because the app was uninstalled prior to the push.
- N user’s removed from audience because they’ve denied push notifications: The number of user devices with a push token but have denied push notification permission.
- N requests failed due to other reasons: The number of push API requests that could not be sent due to other reasons. For a list of error codes you might receive when using the Push API, see the Swrve Push API guide.
- Successfully sent to push service: The number of user devices that qualified for the push notification and were processed by Swrve’s push notification batch job.
- N rejections from push service: The number of device tokens immediately rejected by Apple or Google (due to token invalidity, for example). To view the error message returned by Apple or Google for each rejected device token, select show causes of rejection.
- Total sent from push service to device: The total number of users to whom Swrve sent the notification, and it wasn’t rejected by the push provider.
Push - Inbox
- Sent: The number of users sent the message.
- Read: The number of users who marked the message as read.
- Engaged: The number of users who engaged with the message.
- Deleted: The number of users who deleted the message.
In-app message
- Users: The number of users exposed to the in-app message campaign.
- Viewed: The total number of times the in-app message was shown (for example, the same user may see the message multiple times).
- Engaged: The number of times users who viewed the message engaged with one of the following actions:
- Copy-to-clipboard – Copies the button’s contents to the device’s clipboard.
- Deeplink – Directs users to a custom location by means of a deeplink.
- Engagement rate: The percentage of campaigns viewed that resulted in an engagement.
Embedded
- Users: The number of users exposed to the embedded campaign.
- Delivered: The total number of embedded campaigns successfully triggered (for example, the same user may receive the embedded campaign multiple times).
- Engaged: The number of times users who triggered the campaign engaged with the campaign’s content.
- Engagement rate: The percentage of campaigns triggered that resulted in an engagement.
Campaign goals
This section displays results for the default and custom goals included in your campaign. Depending on the campaign channel, select the user cohort link (for example, Viewed, Sent, Delivered, Opened, Clicked, Engaged) to view the metrics for that group of users.
- Time engaged: The average number of minutes spent in app by users in each cohort.
- No. of sessions: The average number of individual sessions of users in each cohort.
- Revenue: The total revenue generated for the campaign for each user cohort.
- Custom goals: The total number of each custom goal (for example, event count, items purchased) for each user cohort.
Push notification button metrics
For push notification campaigns, if your campaign includes custom buttons, this section displays the number of users who selected each button and the percentage based on the total number of notifications sent.
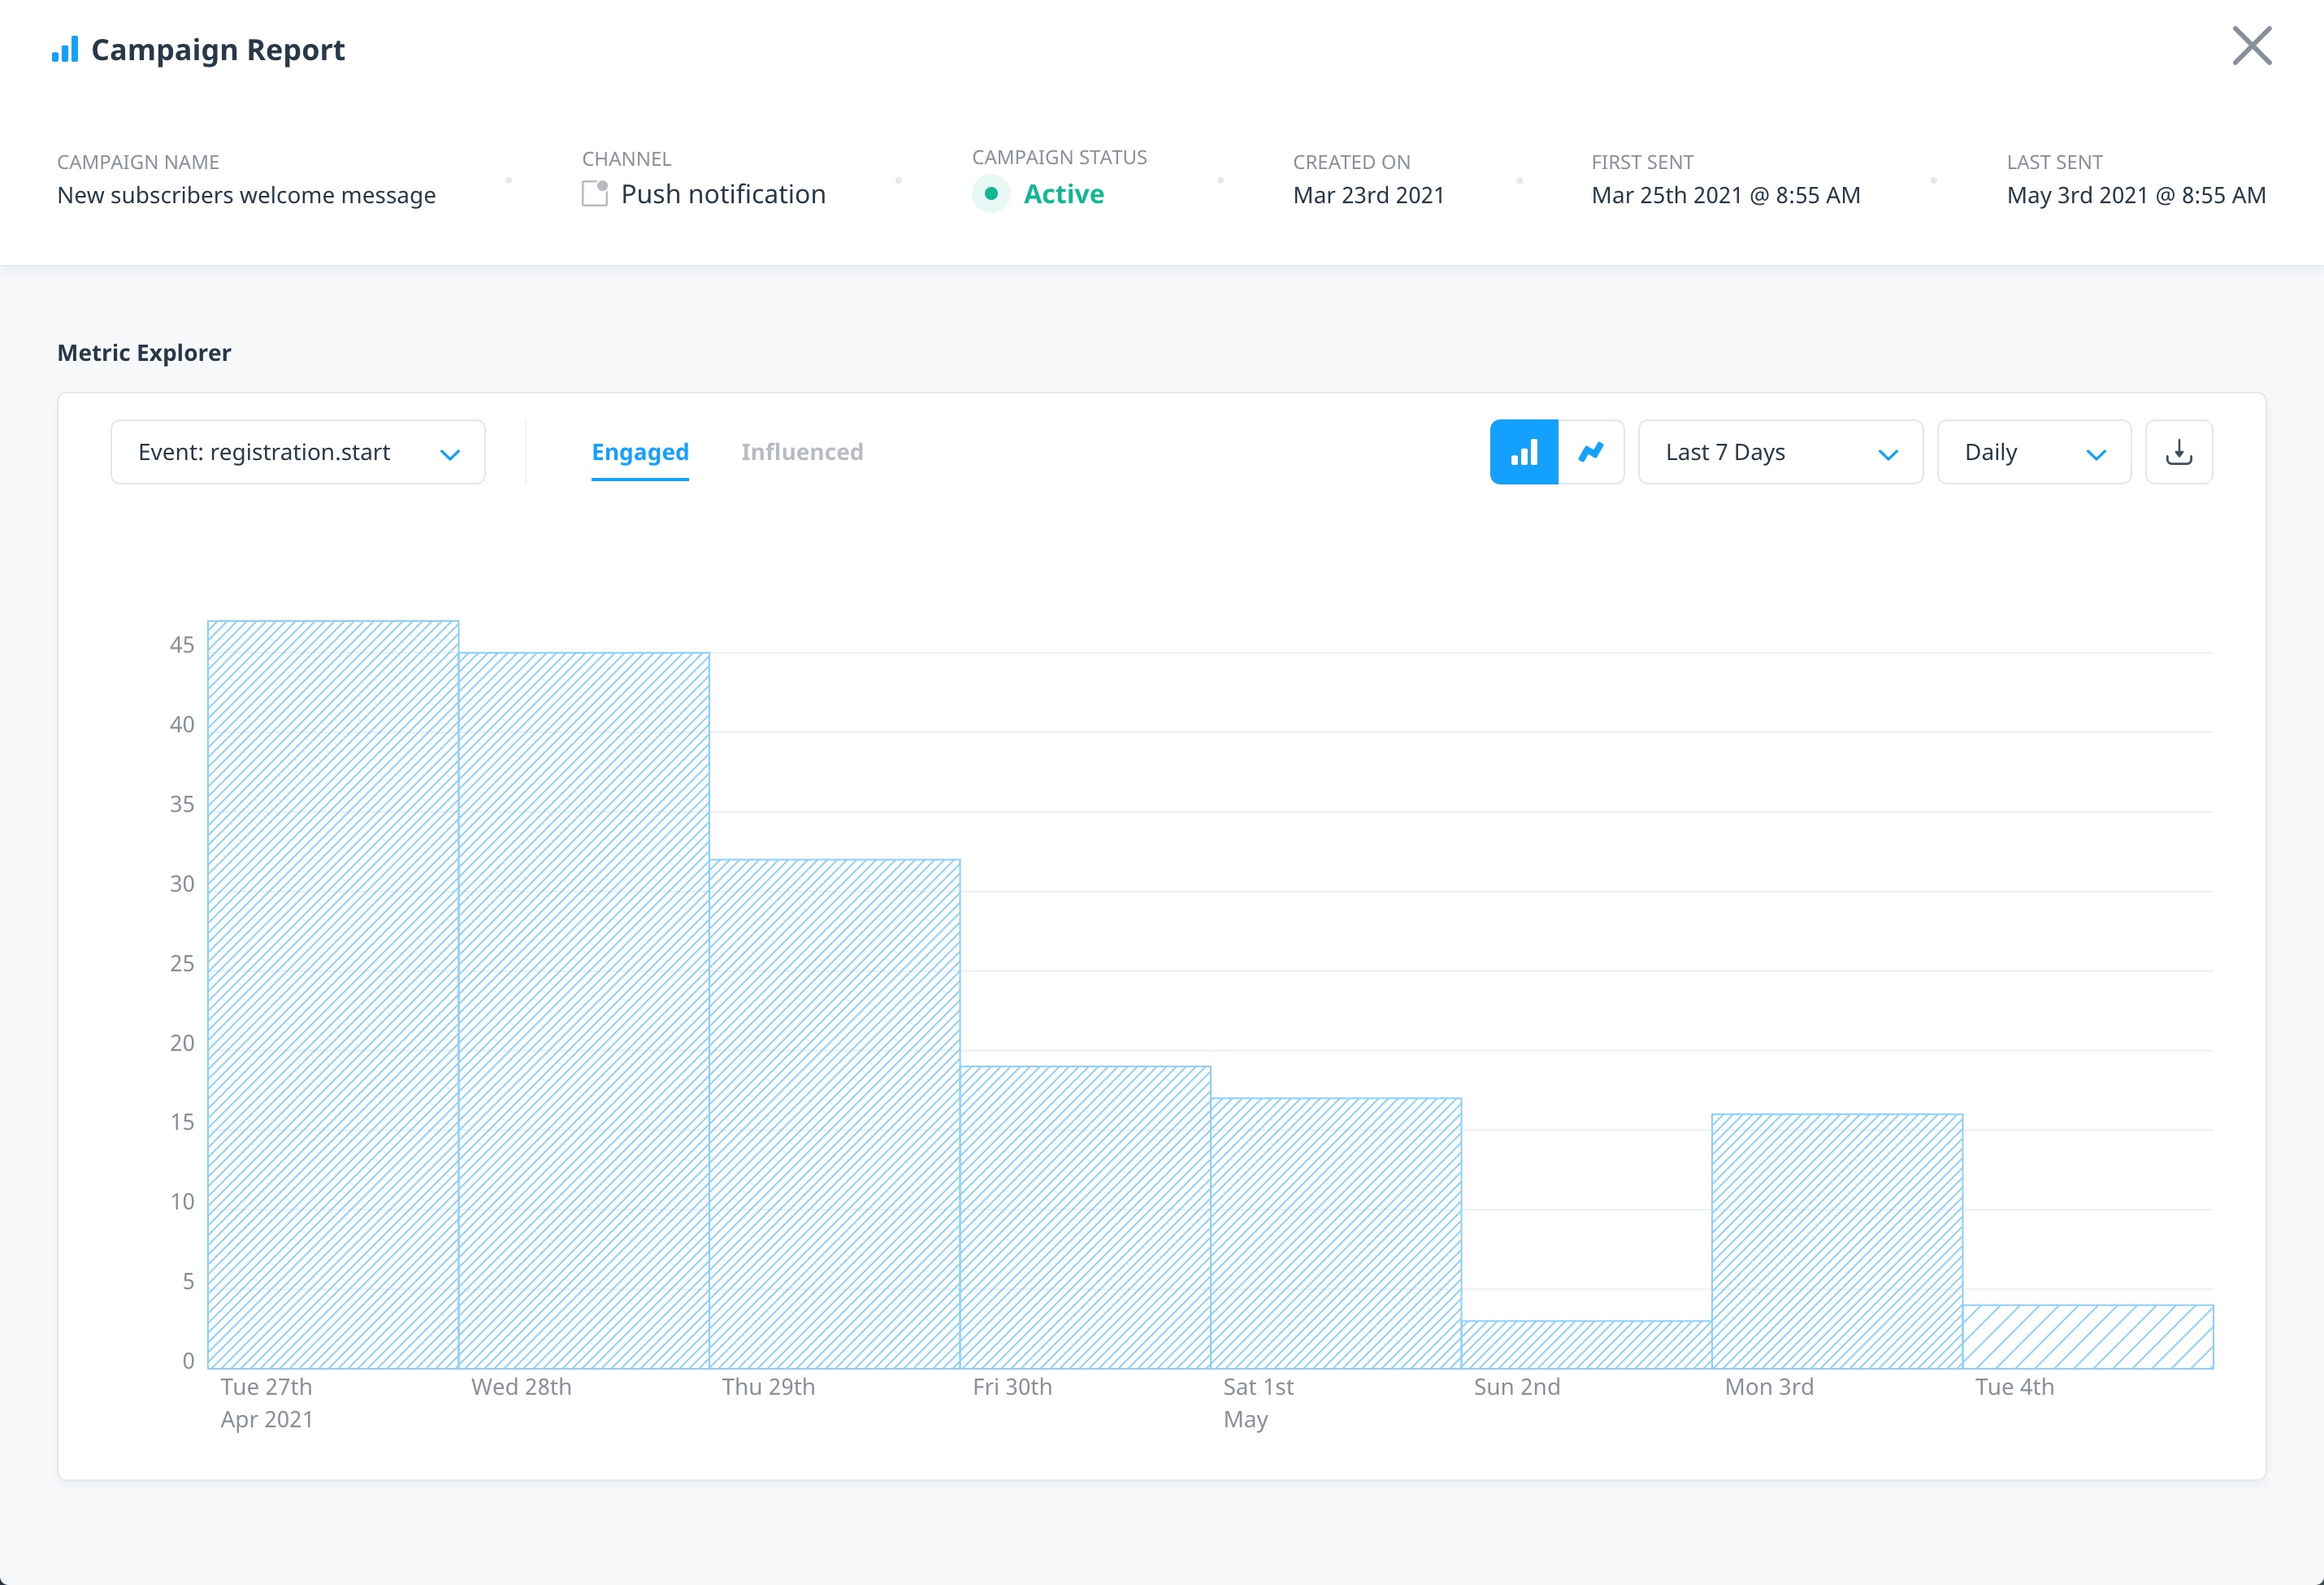
Metric explorer
The Metric explorer displays a bar chart or line graph of certain key metrics for each user cohort (for example, Viewed, Delivered, Opened, Clicked, Engaged), over the selected time series and granularity. The bar chart ![]() shows the totals for the campaign, while the line graph
shows the totals for the campaign, while the line graph ![]() breaks down the metrics by variant, if applicable. To toggle between the two views, select the appropriate icon.
breaks down the metrics by variant, if applicable. To toggle between the two views, select the appropriate icon.
Select a metric from the list to view results for the following:
- Number of Users: Total number of users in each cohort.
- Revenue: Total revenue generated.
- Number of Sessions: The number of sessions started during the selected time granularity. Sessions that span two time granularities are counted against the one in which the session started.
- Time in App: The average number of minutes spent in app by users in each cohort.
- Active Users: The number of users who were active during the selected time series and granularity.
- Revenue / User: The revenue generated per active user.
- Number of Sessions / User: The number of sessions per active user.
- Number of Events: The total number of entry events for each cohort of users (for example, total number of times a user opened or clicked a message).
- Any custom goals selected when creating the campaign.
Campaign metrics are tracked and reported for the attribution period you selected when first setting up the campaign. If the Metric Explorer is not displaying any data for a one-time campaign, try adjusting the time series and granularity to include the campaign date and attribution period.
Time series and granularity
By default, the Metric Explorer displays results for the past 7 days. To view a metric over any combination of time series and granularity, use the options on the right. Each time series displays a default granularity but you can adjust the granularity by selecting another option as required.
| Time series | Default granularity |
|---|---|
| Last 24 hrs | Hourly |
| Last 7 Days | Daily |
| Last 14 Days | Daily |
| Last 4 Weeks | Weekly |
| Last 6 Months | Monthly |
| All Time | Monthly |
Partial data
KPIs are updated regularly throughout the day, so if your chart includes a current time granularity, it may only display partial data (semi-shaded bar).
Download a CSV file of campaign metrics
To download a CSV file of the current selection of metrics and time series, select Download CSV ![]() .
.
Button click reporting
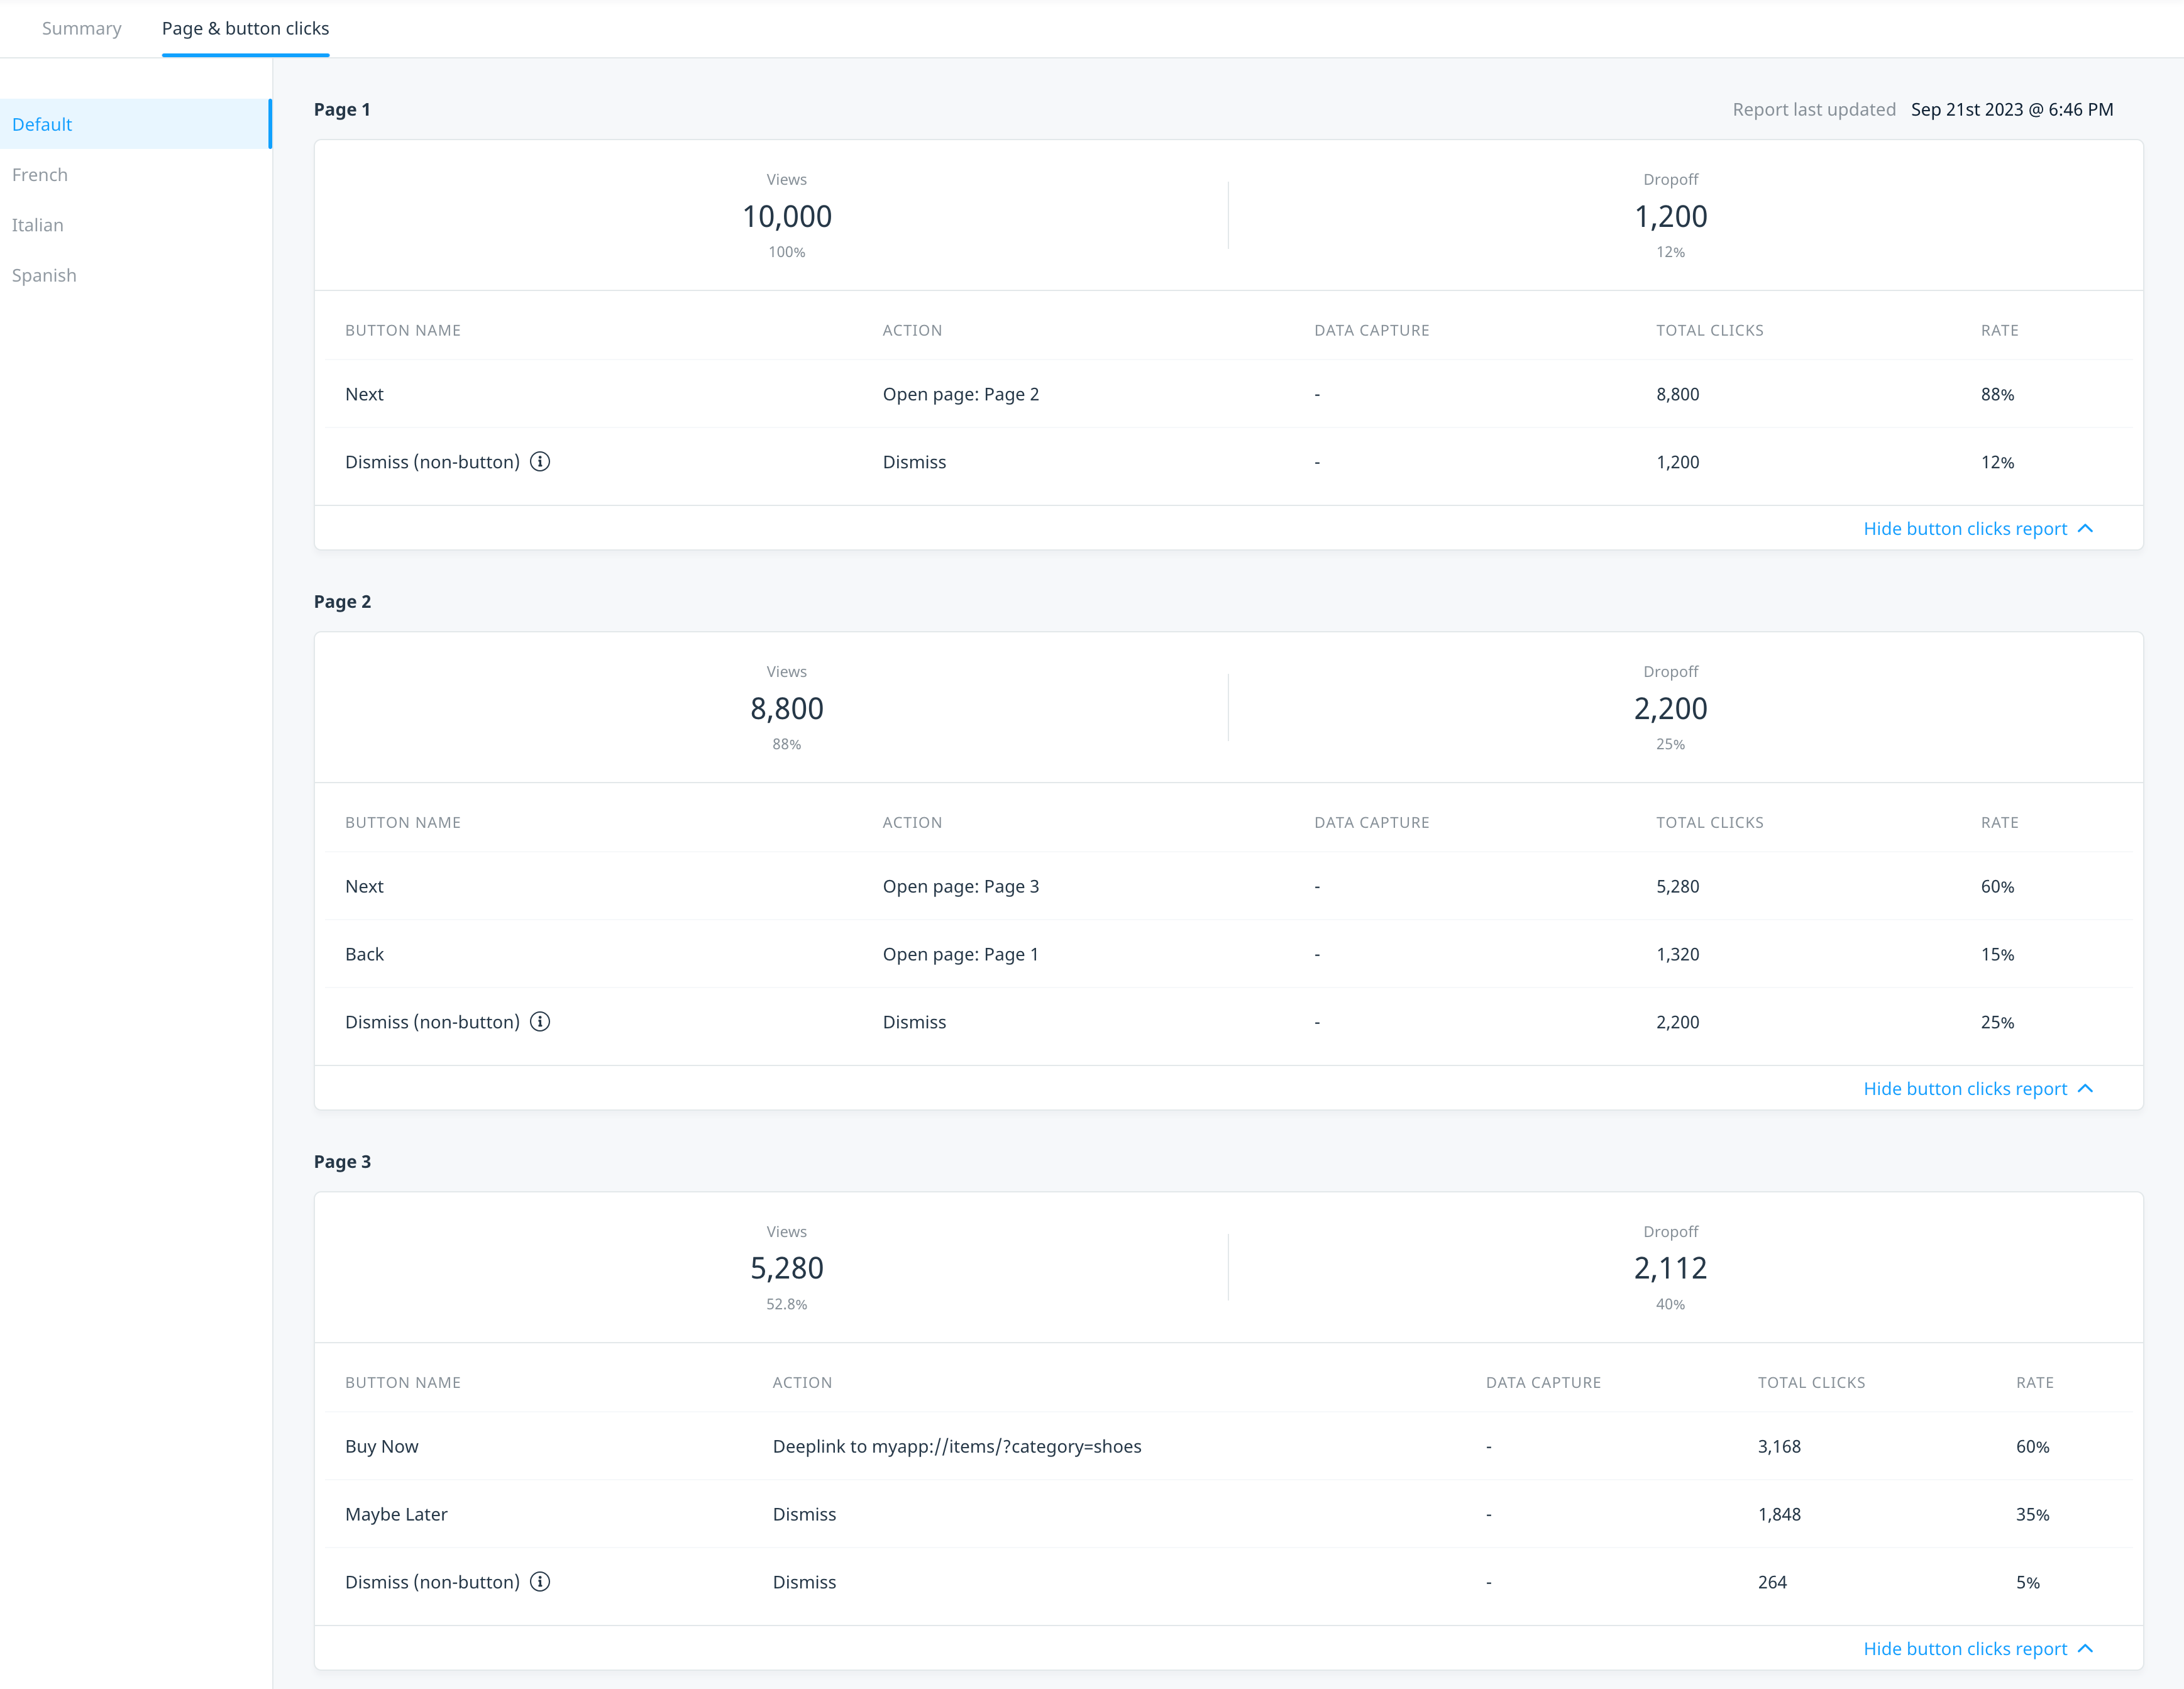
This section displays summary reports for the button clicks associated with your in-app message or embedded campaigns. Only buttons that have an action associated are displayed on this screen. The following page-specific metrics are displayed in the Page & button clicks section.
In-app message
If your campaign is multivariate or multi-language, a tab is displayed with the relevant button clicks report for each variant or language.
- Views: The number of times users viewed the specific page.
- View rate: The number of times users view a specific page per campaign impression, shown as a percentage.
- Dropoff: The number of times users dismissed the campaign while on a specific page.
- Dropoff rate: The number of page dismisses per specific page view, shown as a percentage.
- Button name: The name provided for the button. The default option is Button 1, Button 2 etc.
- Action: The action and value assigned to the button, for example, a deeplink.
- Data capture: The supplementary custom event or user property sent when a user clicks the button
- Total clicks: The total number of times users clicked the button.
- Rate: The number of times users clicked the button divided by the total of all button clicks.
Embedded
- Views: The total number of successfully triggered embedded campaigns
- Button name: The name provided for the button in the button click event (sent from the SDK). The default option is Button 1, Button 2, etc.
- Total clicks: The total number of times users clicked the button.
- Rate: The number of times users clicked the button divided by the total of all button clicks, shown as a percentage
Next steps
- Manage your campaigns from the Swrve Campaign center. For more information, see Managing your campaigns.