Events report
Monitor your app events with the options available in the Events report:
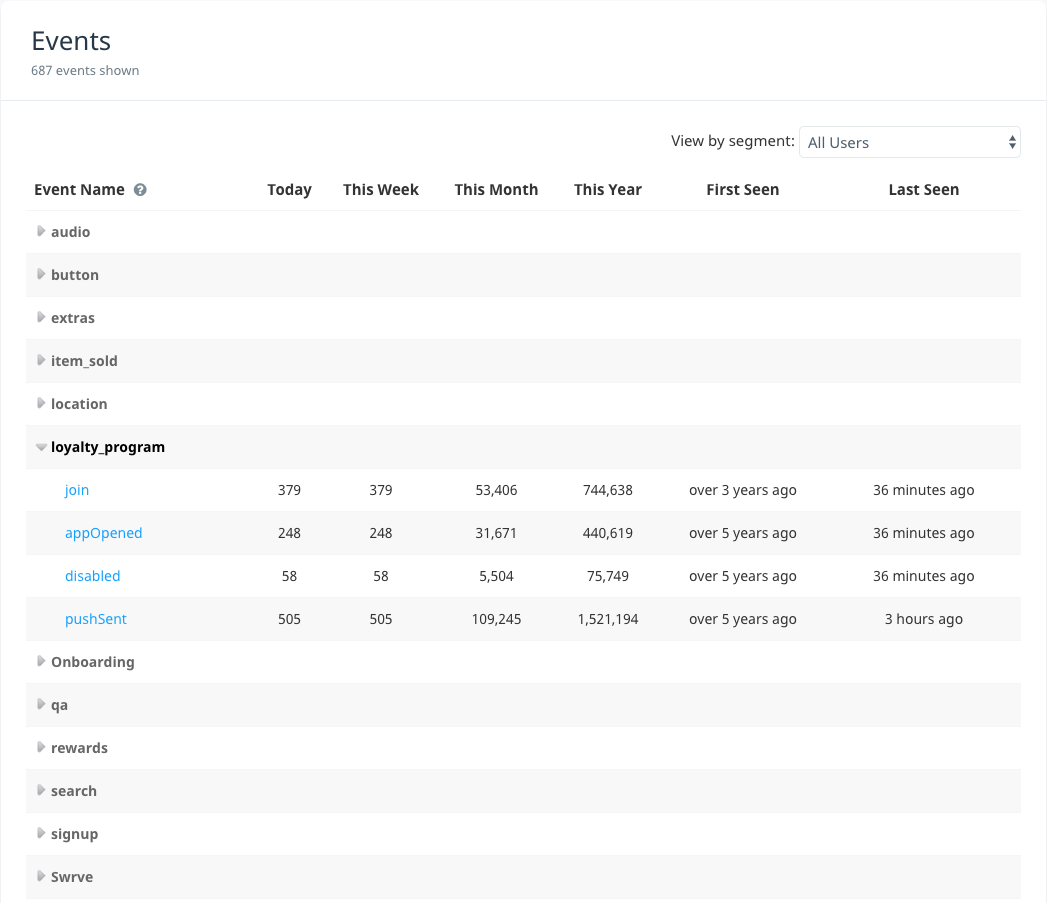
- The Events report displays a high level overview of all the events that your app has sent to Swrve.
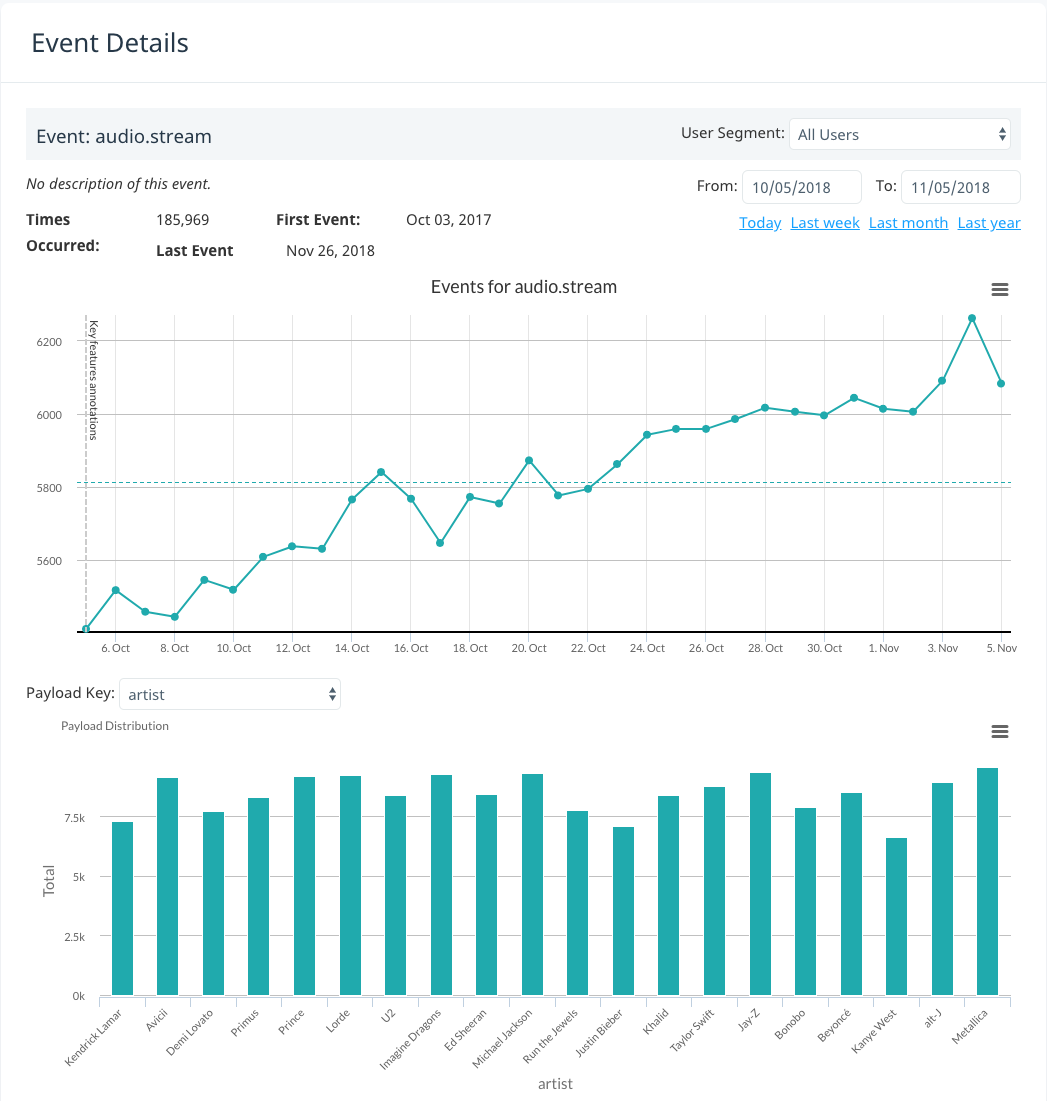
- The Event Details screen displays additional details for a particular event.
Events report
To access the Events report, on the Analytics menu, select Events.
The columns in the report show how many times the event was sent in the past day, week, month and year, and when the event was first and last seen by Swrve. Events are displayed as rows in the table and are contained within expandable nodes in accordance with dot hierarchy. For example, to access the loyalty_program.join event in the image above, first expand the loyalty_program node and then select the event.
To customize the report by user segment, select a segment from the View by segment list.
To view all archived events, select View archived events at the bottom of the report. For more information on archiving and managing your events, see Managing events.
Event Details screen
To view additional details for an event, navigate to the lowest layer in the dot hierarchy for the event in question and select the event name. The Event Details screen is displayed.
The main graph on the Event Details screen displays the number of times the event in question was sent over time. If your event configuration includes payload values, the Payload Distribution chart (or payload histogram) displays the state of your users at the time the event was sent. For example, a media streaming app may have an event called audio.stream with an artist payload key that tracks the name of the artist. Depending on the number of values for the payload key, the Payload Distribution chart displays the following if this payload key is selected as the basis of the chart:
- The Number of times the event including the payload value was sent.
- The number of times event and payload value were sent expressed as a Percentage of the total number of times the event was sent.
Event Details report update frequency
Swrve updates the event charts on the Event Details screen continuously—generally more than once an hour, and usually as frequently as every few minutes. Due to the manner in which Swrve handles large volumes of event data, statistics are not displayed for approximately the last 60 minutes. The data in the Payload Distribution chart is calculated at a slightly lower priority than the total event count in the main graph, so you may sometimes experience a lag between the numbers reported between the two.
Customizing Event Detail graph data
To customize the data included on your Event Details graph and Payload Distribution chart:
- Select the User Segment for which you want to view data.
- Define the time range for which the data is generated. To manually define the time range, select the dates from the calendar in the From and To box, or select a preset time range—Today, Last week, Last month, Last year.
- On the Payload Key list, select the payload key for which you want to view payload values.
Additional actions
The following actions are available on the Event Details screen.
Print graph and chart data
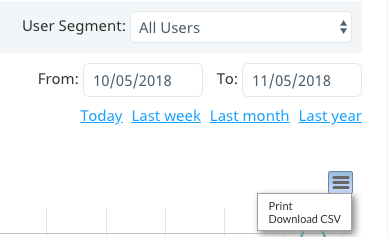
To print the graph or chart, on the menu in the top right-hand corner of the graph or chart, select Print. Depending on the type of browser you are using, the print screen or print dialog box displays. Define your required print settings and print the report.
Save graph data in CSV format
To save the graph or chart data in comma-separated values (CSV) file format, on the menu in the top right-hand corner of the graph or chart, select Download CSV. The CSV file is downloaded to your local machine.


