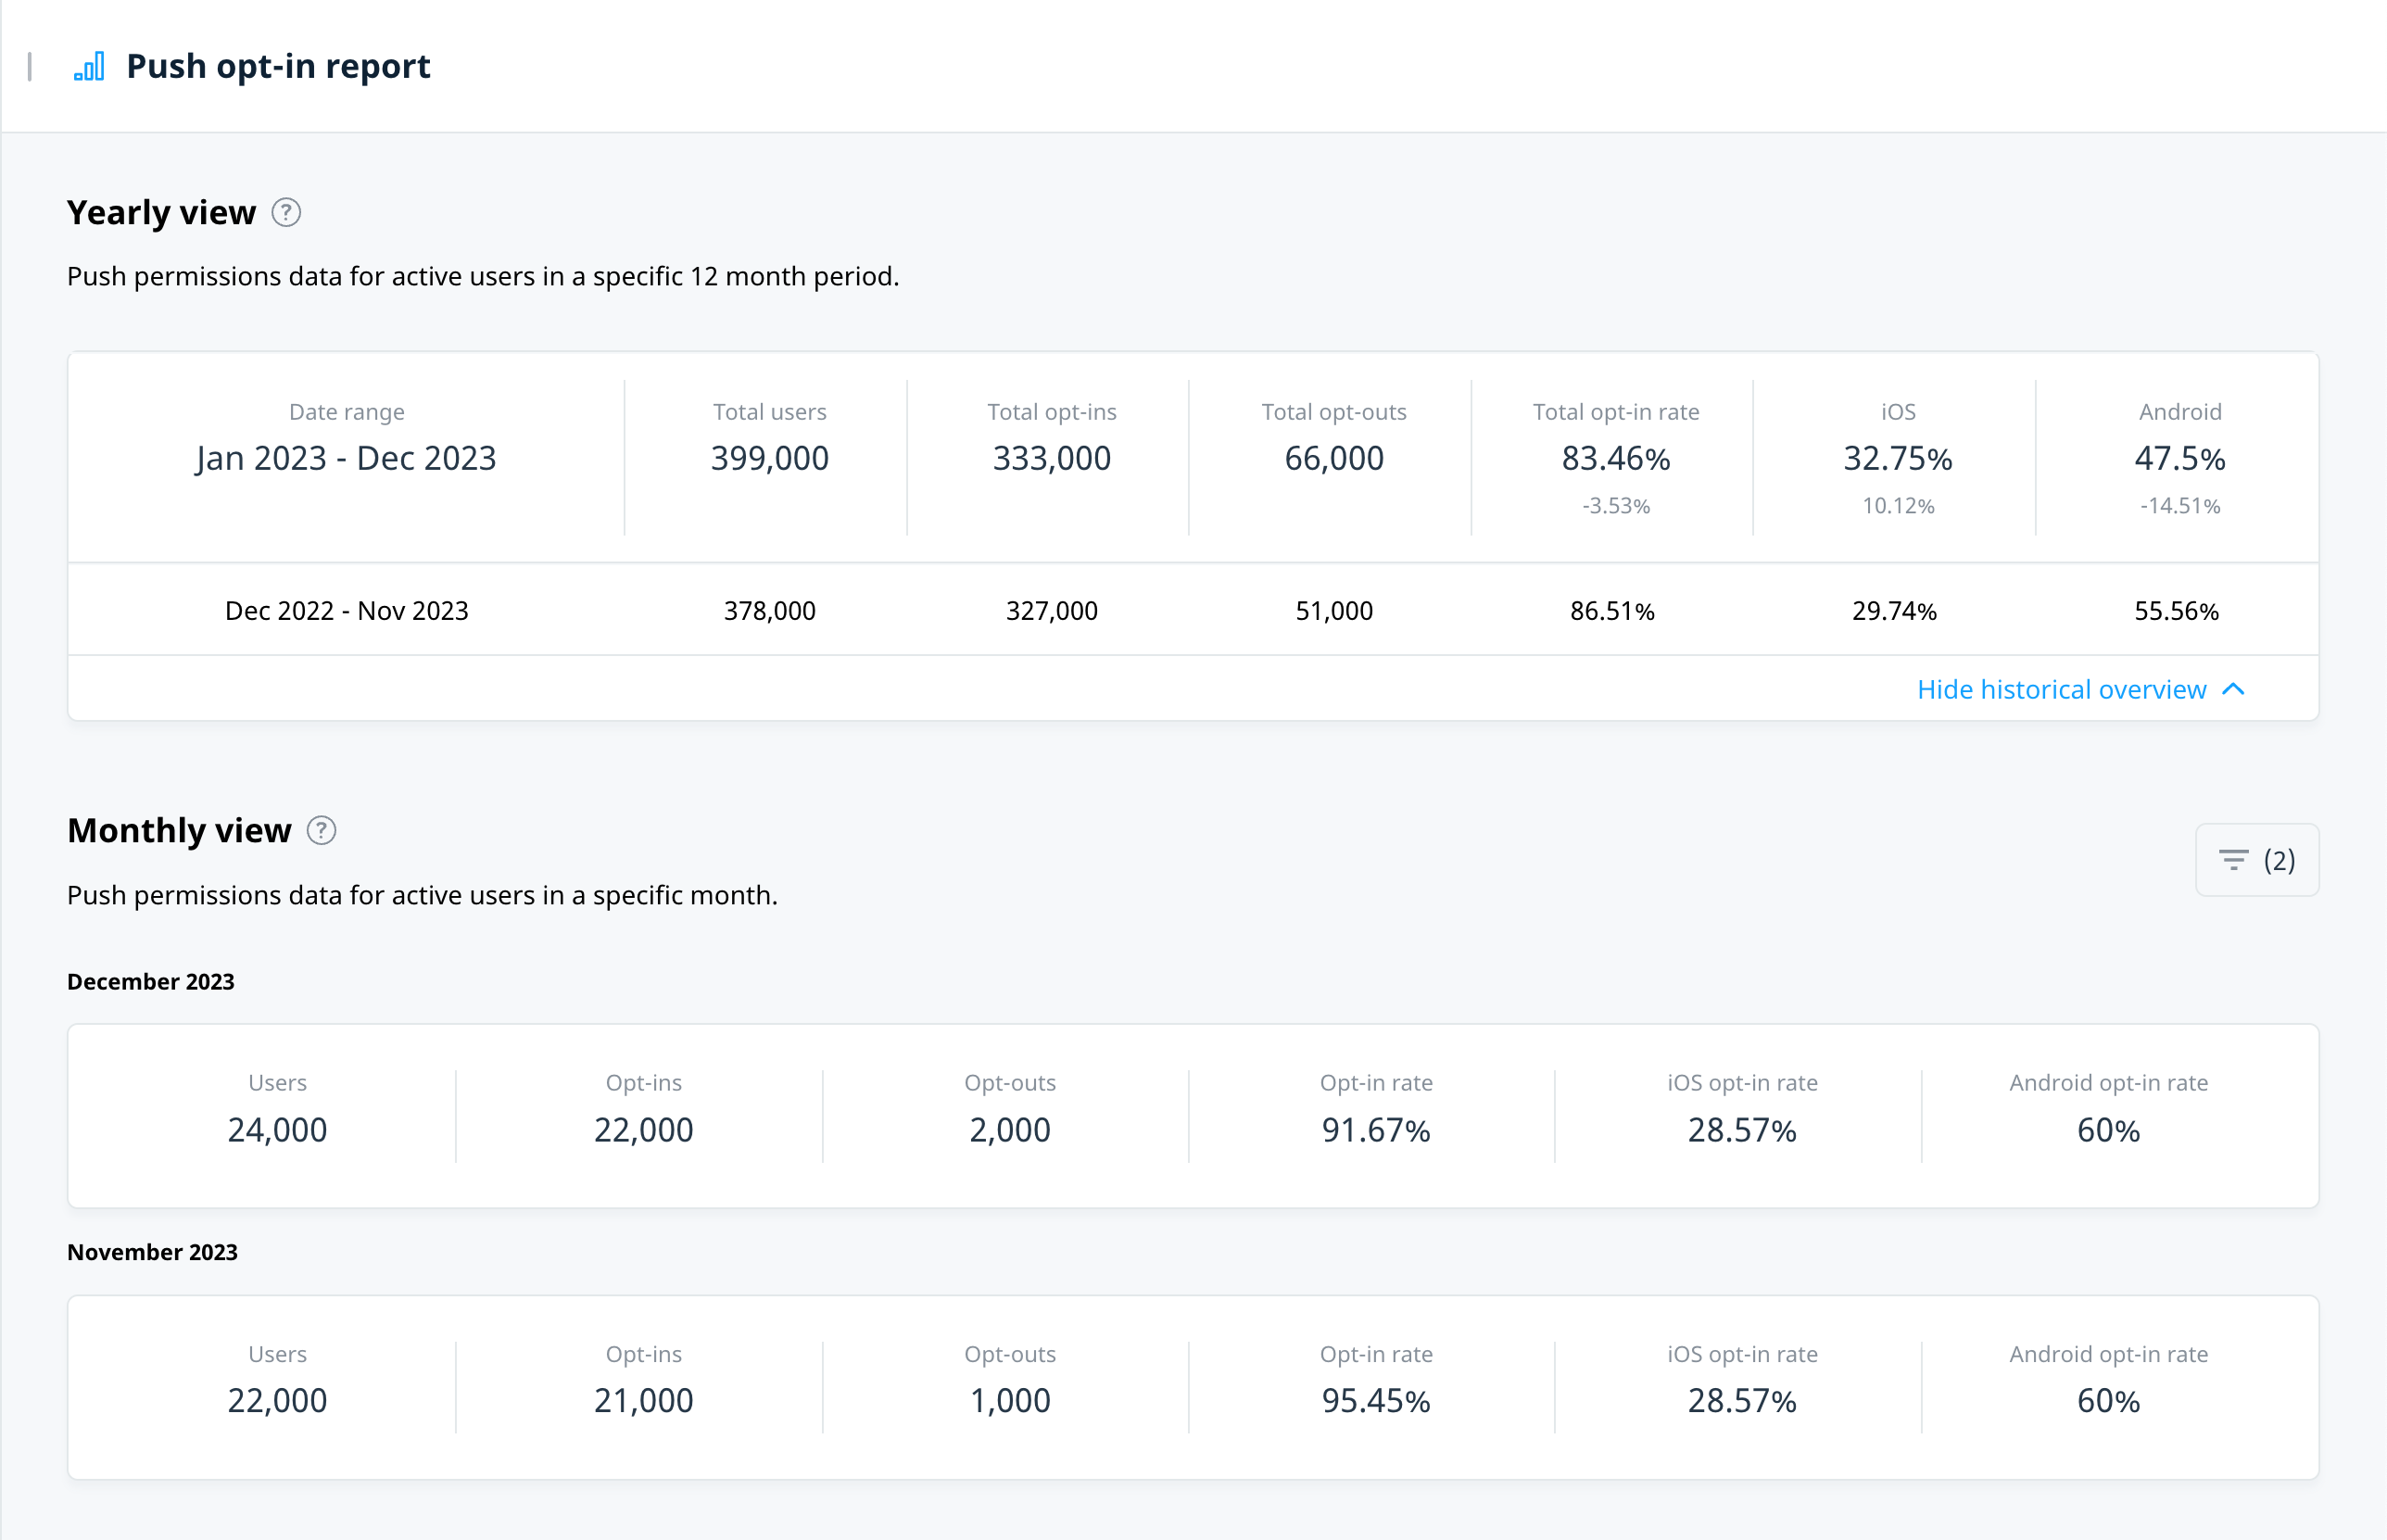
Push opt-in report
Native in-app messaging provides a direct call-to-action for acquiring push permissions through a button click. This guide shows you how to increase overall user opt-in rates by tracking progress on a weekly or monthly basis.
Rate calculation
The push notification opt-in rate refers to the percentage of users who enable push notifications from a mobile app. The opt-in rate is the ratio of users who have actively granted permission for the app to send them push notifications and the total number of users of the app who have a device that’s eligible to receive push notifications (for example, TV devices do not support receiving push notifications).
Opt-in rate = (total opt-in users / total users with a push-eligible device)*100
Report views
Push opt-in metrics provide a yearly and monthly view of users’ push permissions.
Yearly view
At the end of each month, a yearly push opt-in report is made available for review. The calculations for a yearly opt-in report leverage the users’ push permission settings from the current month, going back to the same date in the previous year. For example, a report generated at the end of October 2023, includes all of the data from October 31st 2022 to October 31st 2023.
Monthly view
The monthly view displays the opt-in metrics for the current month. You have the option to review and compare monthly figures using the integrated filtering option. At the end of a month, Swrve logs a new entry and it is available to select from the month filter list. All metric calculations occur on a daily basis for the current month.
Monthly filtering
To filter the months displayed in the push opt-in report:
- In the Monthly view section, select filter.
- From the list, choose the required month(s).
- To remove a month from the view, deselect it from the list.
Next steps
- For more information on acquiring permissions using in-app campaigns, see Introduction to In-app messages.


