Managing geo-triggered campaigns
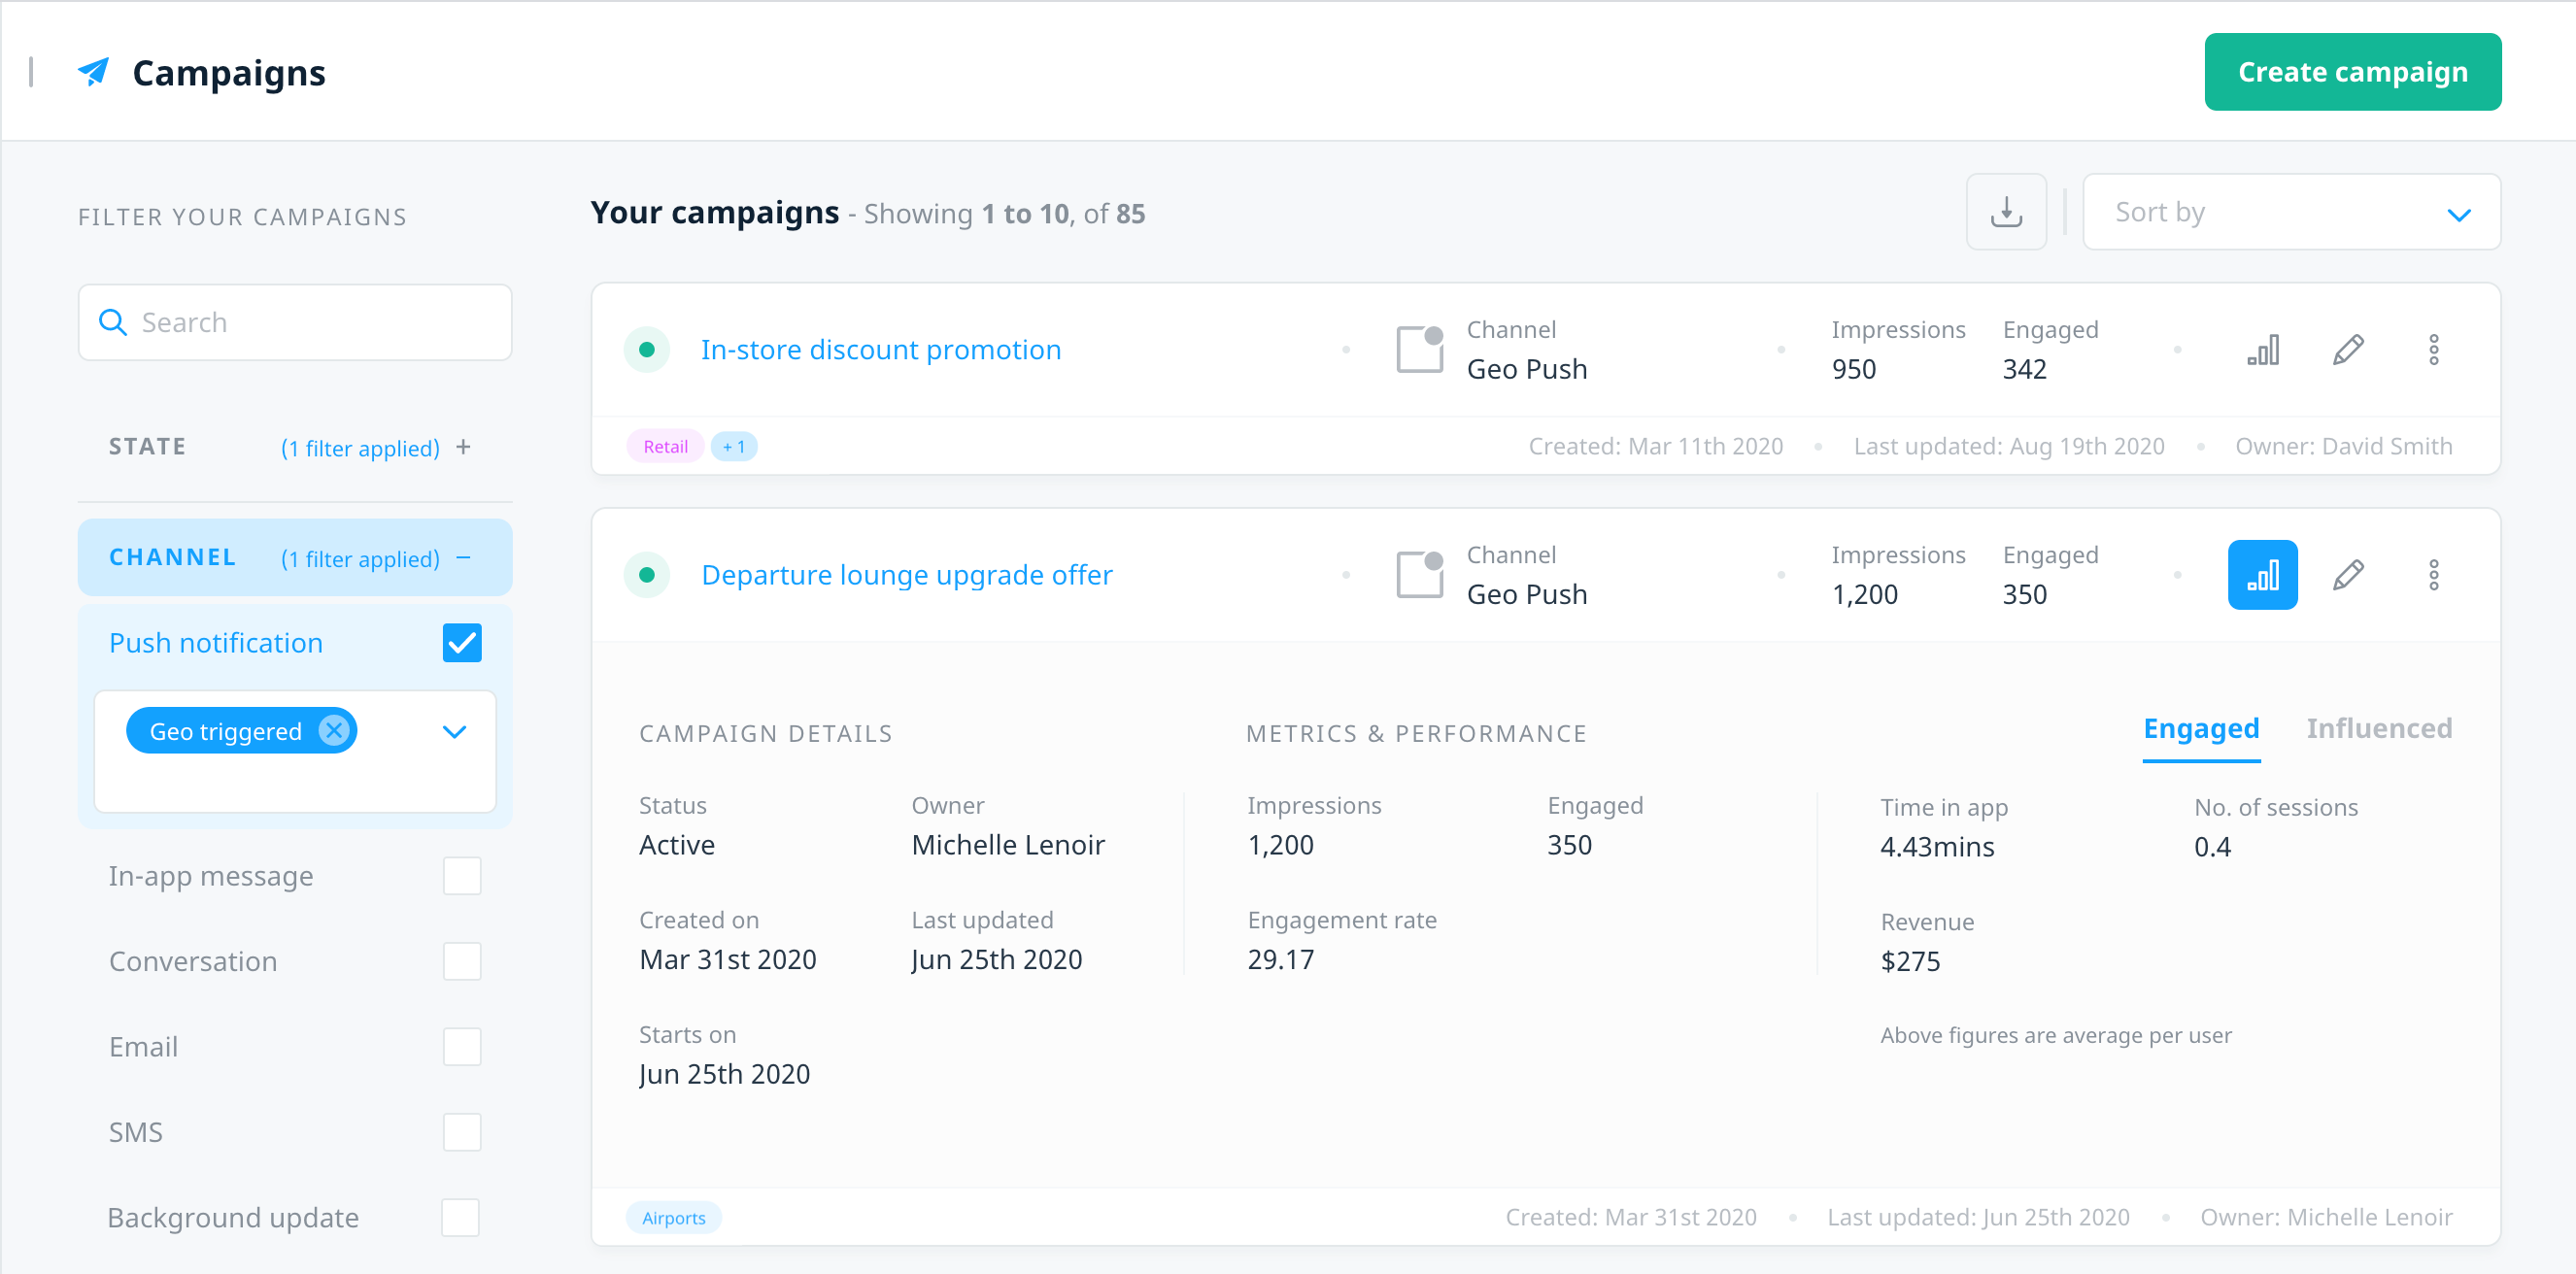
Swrve’s Campaign center has two options for viewing your geo-triggered notification campaign results. To display only geo-triggered campaigns, filter your campaign view by state and channel, or use the search box to display geo push campaigns.
- To expand the campaign card and view high-level metrics of a specific campaign, select View metrics
 .
. - To view a more detailed campaign report, on the Actions menu, select View Campaign.
You can perform the following actions in the Campaign center:
- Create a new geo-triggered campaign. For more information, see Creating geo-triggered campaigns.
- Edit a campaign in Draft status by selecting Edit campaign on the campaign card.
- View the more detailed campaign report by selecting the campaign name or View Campaign from the Actions menu.
- On an individual campaign summary card, use the Actions menu to:
- Delete a campaign in Draft status by selecting Delete campaign.
- Create a copy of a campaign by selecting Duplicate campaign.
- Archive an Inactive or Finished campaign by selecting Archive campaign.
- Create and download a CSV file of the results for all of your campaigns. For more information, see Downloading campaign reports.
Understanding your campaign reports
To view the detailed report for a particular campaign, on the Actions menu, select View campaign.
For campaigns in any other state than Draft or Pending, the individual campaign report includes a detailed report of key campaign metrics (Campaign Report tab) and an overview of the campaign content and delivery results (Campaign Details tab).
Campaign Report tab
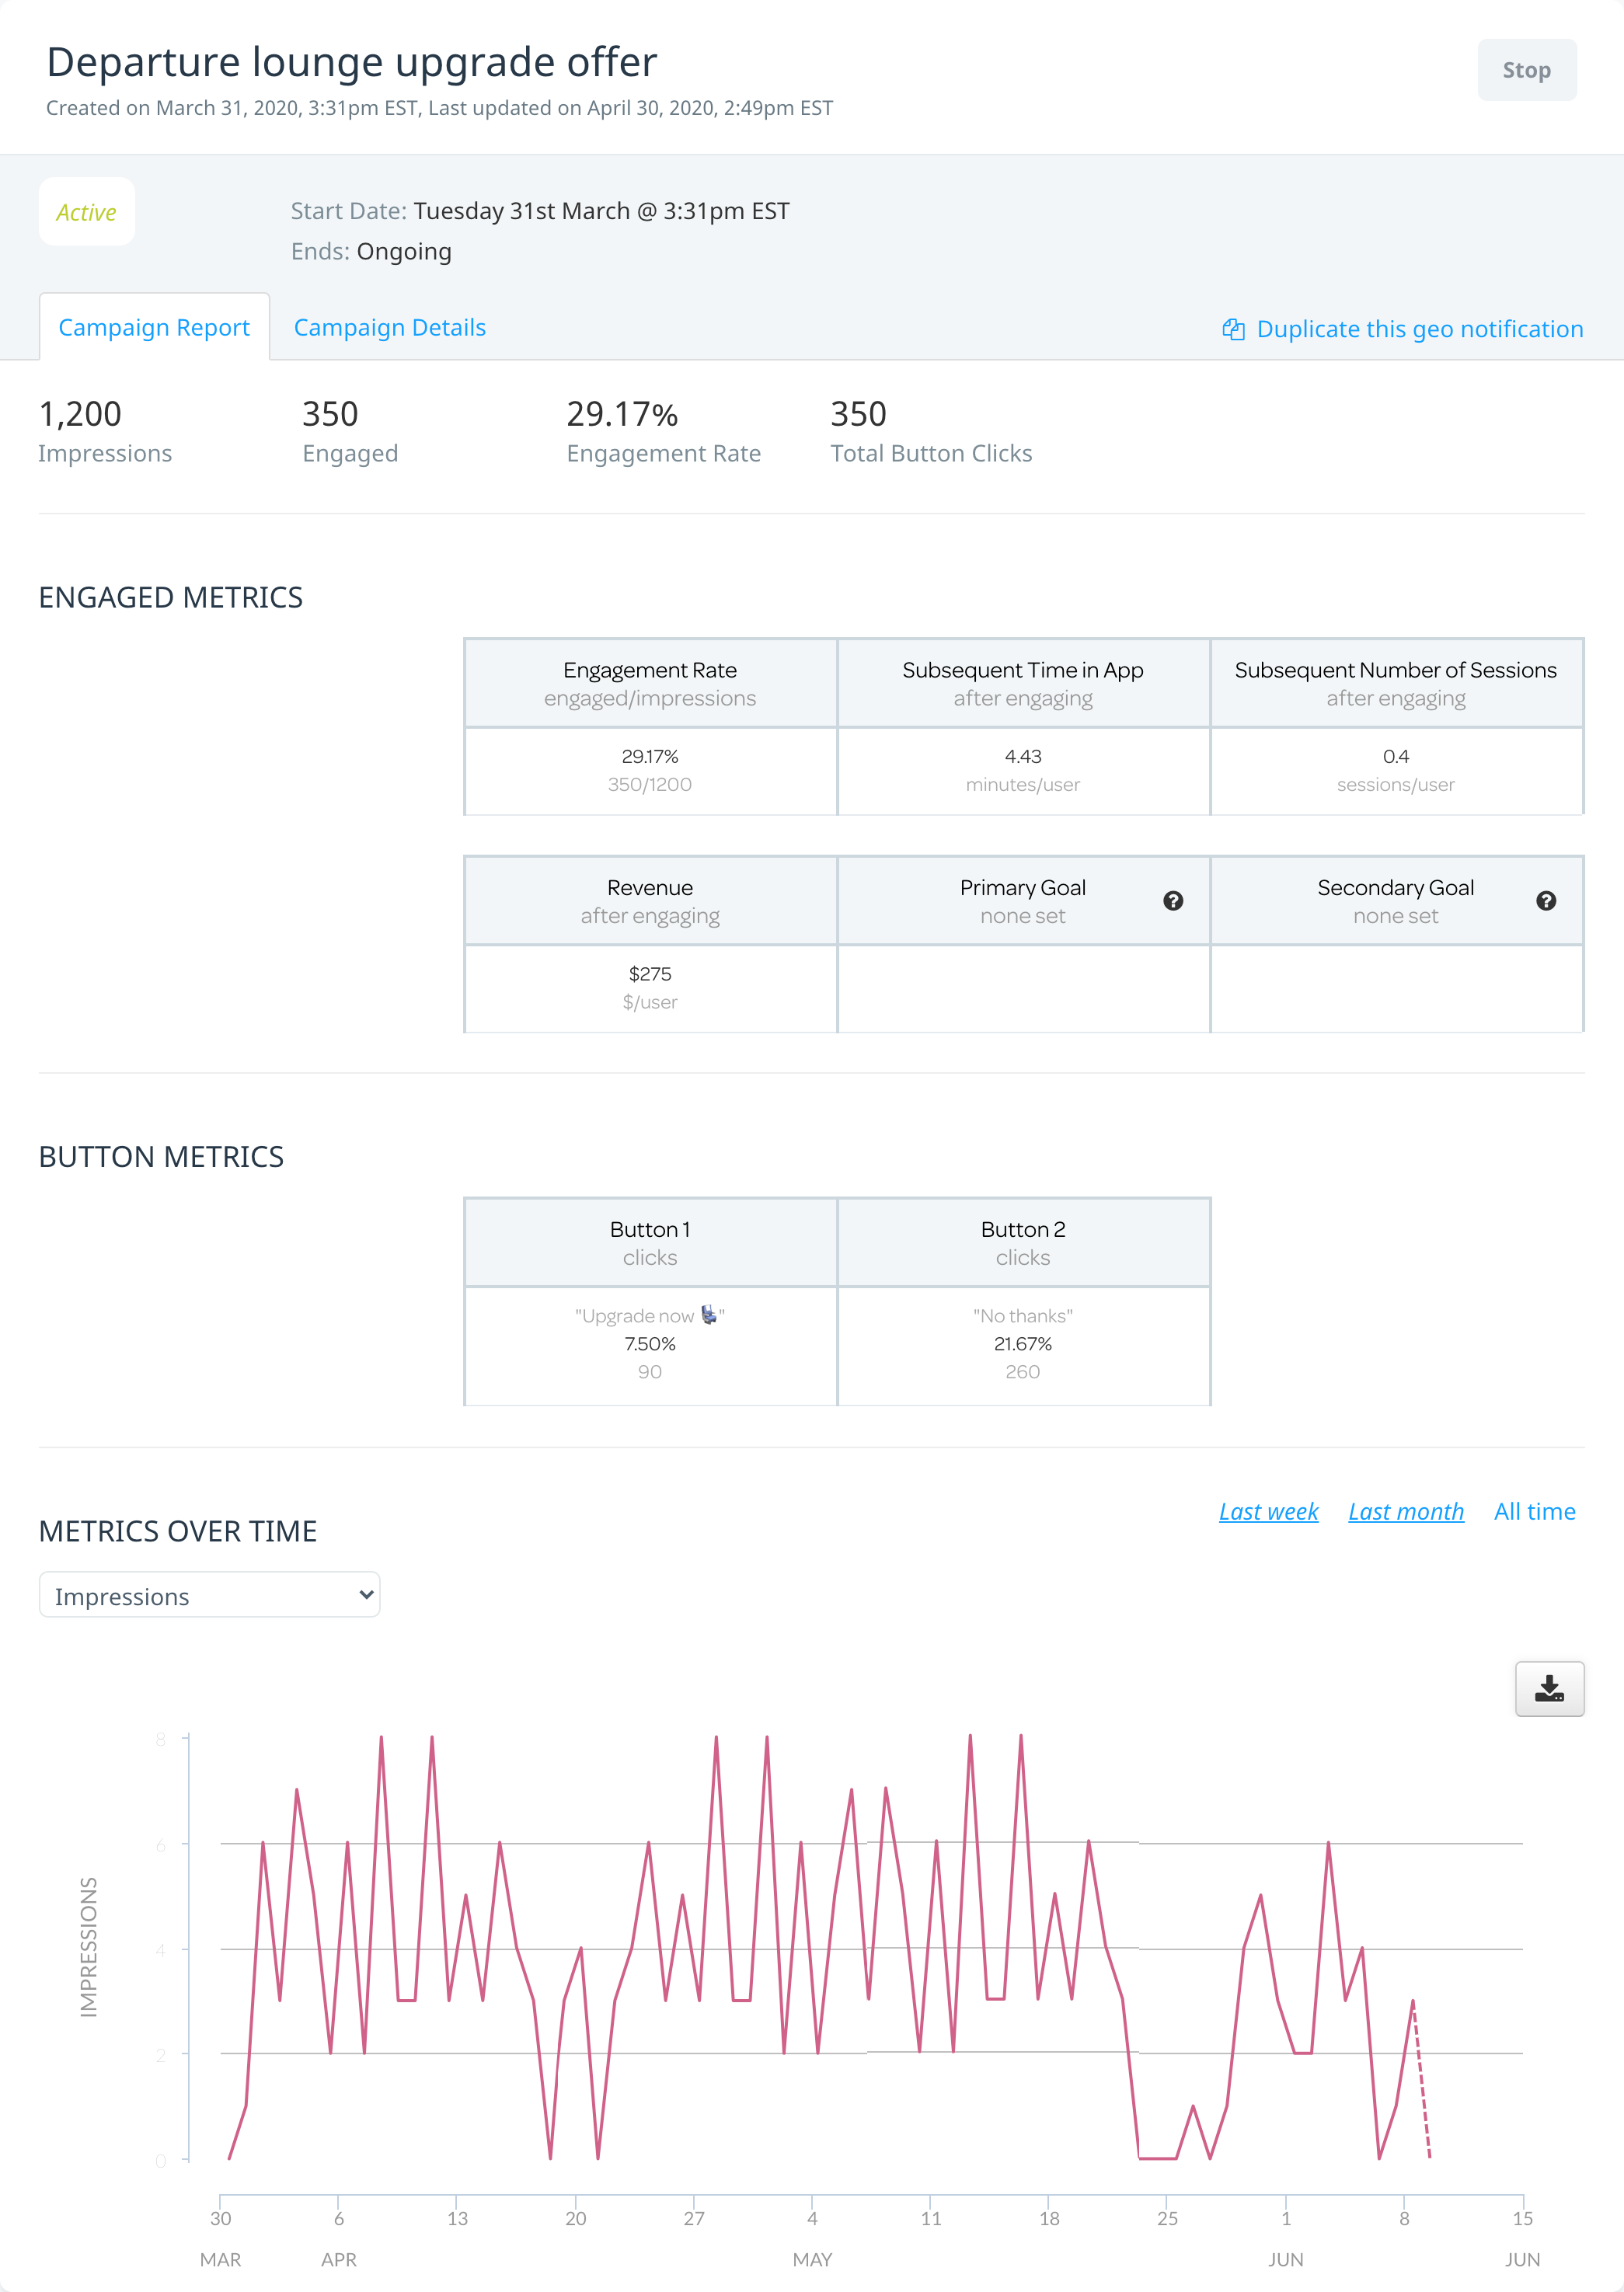
The Campaign Report tab displays the default tracking metrics as well as any custom goals you selected when creating the campaign. The top of the report displays overall totals for the following performance indicators:
- Impressions – the total number of users who received the geo-triggered notification.
- Engaged – the number of recipients who opened your app by accepting the notification.
- Engagement Rate – the percentage of recipients who opened your app by accepting the notification.
- Total Button Clicks – if your notification included buttons, the total number of users who clicked a button.
Engaged metrics
The engaged metrics section displays the default and custom metrics for engaged users:
- Engagement Rate – Same as above.
- Subsequent Time in App – The average number of minutes spent in the app by users after engaging with the notification.
- Subsequent Number of Sessions – This relates to the average number of individual sessions subsequently actioned by users after engaging with the initial geo notification or after being influenced by the campaign.
- Revenue – The average revenue generated per user after engaging with the geo notification or after being influenced by the campaign.
- Primary and secondary campaign goals – If set, displays the average number of goals triggered per user after engaging with the push notification or after being influence by the campaign. These goals are typically specific events or purchases.
- Button metrics – If relevant, includes a breakdown of the individual button clicks for each button.
Metrics over time
The Metrics over time section displays a line graph of various KPIs for the geo notification campaign, including the default metrics, custom goals and standard KPIs. The graph includes the following features to enable you to:
- View results for a selection of KPIs. Select an option from the KPI list to display the related graph.
- View the results for Last week, Last month or All time by selecting the related link.
- Download a CSV file of the selected KPI results by selecting the Download CSV button.
Campaign Details tab
The Campaign Details tab displays an overview of the notification platform, target audience, geoplaces and other triggers, campaign goals, and message content.
Next steps
- Create a new geo-triggered campaign. For more information, see Creating geo-triggered campaigns.
- Manage your geoplaces. For more information, see About geoplaces.

