How do I interpret retention KPIs?
Retention refers to the percentage of users who revisit the app after using it for the first time. Day 1 retention, for example, is the percentage of users who revisit the app 24 – 48 hours after Swrve first sees them (retention is based on a 24-hour rolling clock).
You can use retention figures to measure the quality of a user’s initial experience. Retention rates themselves are expressed as a percentage that indicates which fraction of users that have interacted with the app for the first time on a given day end up returning to your app at some point in the future.
Retention is not measured by a single KPI or graph; Swrve keeps track of many different retention KPIs. The most noticeable ones are Day 1, Day 3, Day 5, Day 7 and Day 30 Retention. The following sections refer to day-N retention, where N is a value that can range from 1 to 30.
For a general overview of the KPIs available in Swrve, see Intro to KPIs. For more information about creating reports using retention KPIs, see Trend Reports.
Viewing retention data
Swrve enables you to access retention data in three different ways:
- The User Cohorts screen displays a cohort view that shows 14 days of data.
- The export API enables you to obtain day-N retention data for values of N ranging from one to 30.
- The KPI Metrics dashboard and Trend Reports provide you with graphs depicting the retention percentages for day-N retention for several handpicked values of N.
The focus of this article is the KPI Metrics dashboard and Trend Reports.
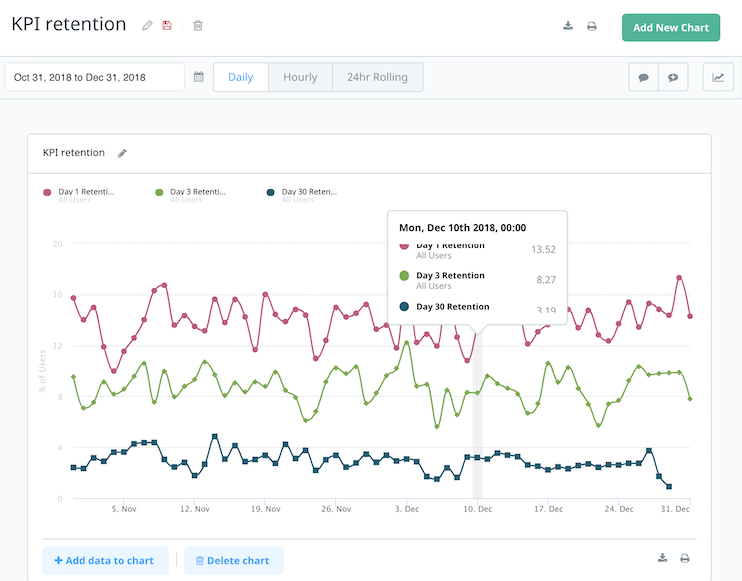
The following figure shows the Day 1, Day 3, and Day 30 Retention KPIs in a sample Trend Report.
Understanding retention data
Swrve defines the value of the day-N retention data for a segment S of a calendar day D as a ratio of A/B.
A is the number of users who:
- Sent their first ever event on calendar day D.
- Joined the segment S at some point during the first 24 hours after sending their first event.
- Were active, as part of segment S, between (24 * N) and (24 * (N + 1)) hours after their first event.
B is the New Users KPI, which is the number of users who:
- Sent their first ever event on calendar day D.
- Joined the segment S at some point during the first 24 hours after sending their first event.
This approach highlights that the day-N retention value corresponds to the percentage of new users that remains active in your app after a specific period of time has passed.
Example scenarios
The example scenarios below illustrate how day-N retention is calculated.
Example 1
This example illustrates how Day 1 Retention is calculated for the All Users segment. As a user is always part of the All Users segment, the day-N retention definition is simple; the day-N retention data for the All Users segment of a calendar day D is a ratio of A/B. A is the number of users who sent their first ever event on calendar day D and were active between (24 * N) and (24 * (N + 1)) hours later. B is the number of users who sent their first ever event on calendar day D.
A single user sends the following sequence of events with the following timestamps:
- 2018-07-04 00:01 AM – user sends user event.
- 2018-07-04 11:01 PM – user sends IAP event.
- 2018-07-05 06:01 AM – user sends purchase event.
In this example, a user sends their first event at 2018-07-04 00:01 AM. At this point Swrve marks this user as having used the app at least once. This user returns 23 hours later and sends another event at 2018-07-04 11:01 PM. Nothing happens, as the definition of Day 1 Retention states that this KPI only counts those users who were active between 24 and 48 hours after their first event. The user then sends another event 7 hours later at 2018-07-05 06:01 AM. As this event happens between 24 and 48 hours after the user’s very first event, this user is now marked as day-1 retained.
Day 1 Retention data is a ratio of A divided by B. A is the number of users who had their first ever event on calendar day D and were active between 24 and 48 hours later. B is the number of users who had their first ever event on calendar day D. In this particular case—assuming that this app only has one user—A has a value of 1 for 2018-07-04 and B also has a value of 1 for 2018-07-04. Therefore, the retention for 2018-07-04 is 100%.
While this example scenario is very basic, it illustrates a very important aspect of the day-N retention calculation. In this example, the event that caused the user to be counted as day 1 retained was sent on 2018-07-05 06:01 AM, but the user ended up being counted towards the retention of day 2018-07-04 as this is the calendar day on which the user sent their first event. Because of how retention data can end up being written to an earlier point in time, retention results for a recent day are not fully counted until a minimum window of time has lapsed.
The size of this window of time is 48 hours for Day 1 Retention and is generally calculated as (24 * (N + 1)) hours for day-N retention. This means that you cannot determine the Day 1 Retention reported on July 4th until after midnight on July 6th. As such, the Day 1 Retention data for July 4th reaches its correct value progressively, starting a minute after midnight on July 4th, and finishing just after 11:59 PM on July 6th. This means that the final Day 1 Retention value for July 4th is available on the morning of July 7th.
In the case of Day 5 Retention, this window of time is 144 hours. This means that the Day 5 Retention data on July 4th is finalized just after 11:59 PM on July 10th. So, while you can view partial retention data as it grows, you should not be concerned if the value seems low.
Example 2
This examples illustrates how Day 1 Retention is calculated for an example segment called Spenders. This segment contains those users who have sent at least one IAP event.
The following events were sent:
- 2018-07-04 12:01 PM – user sends user event.
- 2018-07-05 10:01 AM – user sends IAP event.
- 2018-07-05 11:01 AM – user sends purchase event.
- 2018-07-05 06:01 PM – user sends purchase event.
The user sends their first event on 2018-07-04 12:01 PM and sends an IAP event 22 hours later at 2018-07-05 10:01 AM. Therefore, this user joins the Spenders segment during their first 24 hours after sending their first event.
The user sends another event 23 hours after their first one, but this has no impact on the Day 1 Retention calculation as this event doesn’t happen between 24 and 48 hours after the first one. The next event takes place 7 hours later, meaning that it happens between 24 and 48 hours after the first one. Therefore, the value of A for the Spenders segment is 1 for the day 2018-07-04. A similar reasoning shows that the value of B for the Spenders segment also ends up being 1 for this day. Hence the value of the Day 1 Retention KPI for the Spenders segment for calendar day 2018-07-04 is 100%.
Although the user didn’t end up joining the Spenders segment until 2018-07-05, they are nevertheless counted towards the Day 1 Retention data of the Spenders segment of day 2018-07-04, as they sent their first event on that day.
Example 3
The previous example involved an example segment called Spenders. Once a user has joined this segment, they can no longer leave it; a user cannot undo a previously-sent IAP event. These types of segments are known as latched segments.
However, there are other types of segment that users can join and leave at a later data; for example, a segment that only contains those users that own five or more gold coins. A user joins this segment upon acquiring five or more gold coins and leaves this segment upon spending some of them. This example illustrates how day-N retention is calculated for this type of segment.
The following events were sent:
- 2018-07-04 01:01 AM – user sends user event indicating they have five gold coins.
- 2018-07-04 02:01 AM – user sends user event indicating they have three gold coins.
- 2018-07-05 03:01 AM – user sends purchase event.
- 2018-07-05 04:01 AM – user sends user event indicating they have six gold coins.
The user’s very first event happens on 2018-07-04 01:01 AM and indicates this user has acquired five gold coins. Therefore, this event causes the user to join the ‘has 5 or more gold coins’ segment. An hour later the user sends another event that indicates they have lost two coins. This event causes the user to leave the ‘has 5 or more gold coins’ segment.
The next event happens 26 hours after the user’s very first event and causes the user to be counted towards the Day 1 Retention KPI of the All Users segment on day 2018-07-04. However, the event does not make the user contribute to the Day 1 Retention KPI of the ‘has 5 or more gold coins’ segment, as the user was not part of this segment at the time of this event.
An hour later the user sends another event indicating that they now own six gold coins. Therefore, this event causes the user to rejoin the ‘has 5 or more gold coins’ segment. As this event happens between 24 and 48 hours after the user’s very first event, the user now contributes to the Day 1 Retention KPI of the ‘has 5 or more gold coins’ segment for the day 2018-07-04.